 Anuluj
Warunki handlowe
Narzędzia


GBP/USD also showed mixed movements on Wednesday, partly influenced by macroeconomic data. In the morning, the UK released Service and Manufacturing PMI data, which came in better than forecasts. These reports supported the pound. In the afternoon, the same U.S PMI indexes were worse than expected, causing the dollar to weaken for a while. However, a technical pullback began by the end of the day, further complicating the intraday technical picture.
Like the euro, the British pound also has technical reasons for a decline, but in the past three days, the price has moved more sideways than downward. Volatility remains low, and we are now observing movement that closely resembles a flat.
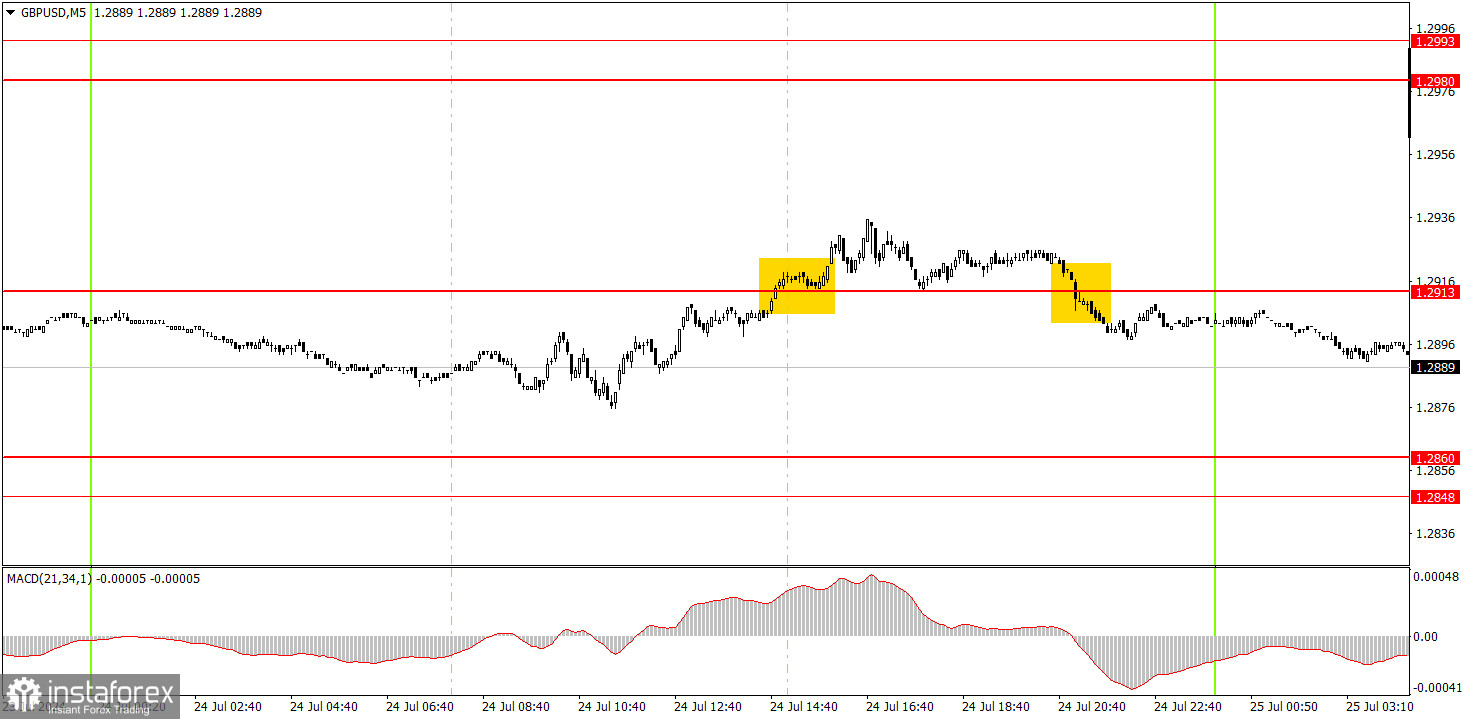
Two trading signals were generated in the 5-minute timeframe, but it would have been better if they were not formed. At the start of the U.S. session, the price broke through the 1.2913 level but failed to rise actively due to weak volatility. By the time the signal was generated, the pair had already risen about 40 pips, almost the maximum allowable in these circumstances. Later in the evening, a sell signal was formed around the same level. However, it is far from certain that the decline will continue today, as the hourly timeframe shows that the movement is more akin to a flat, and no one knows how Thursday's data will impact the market.
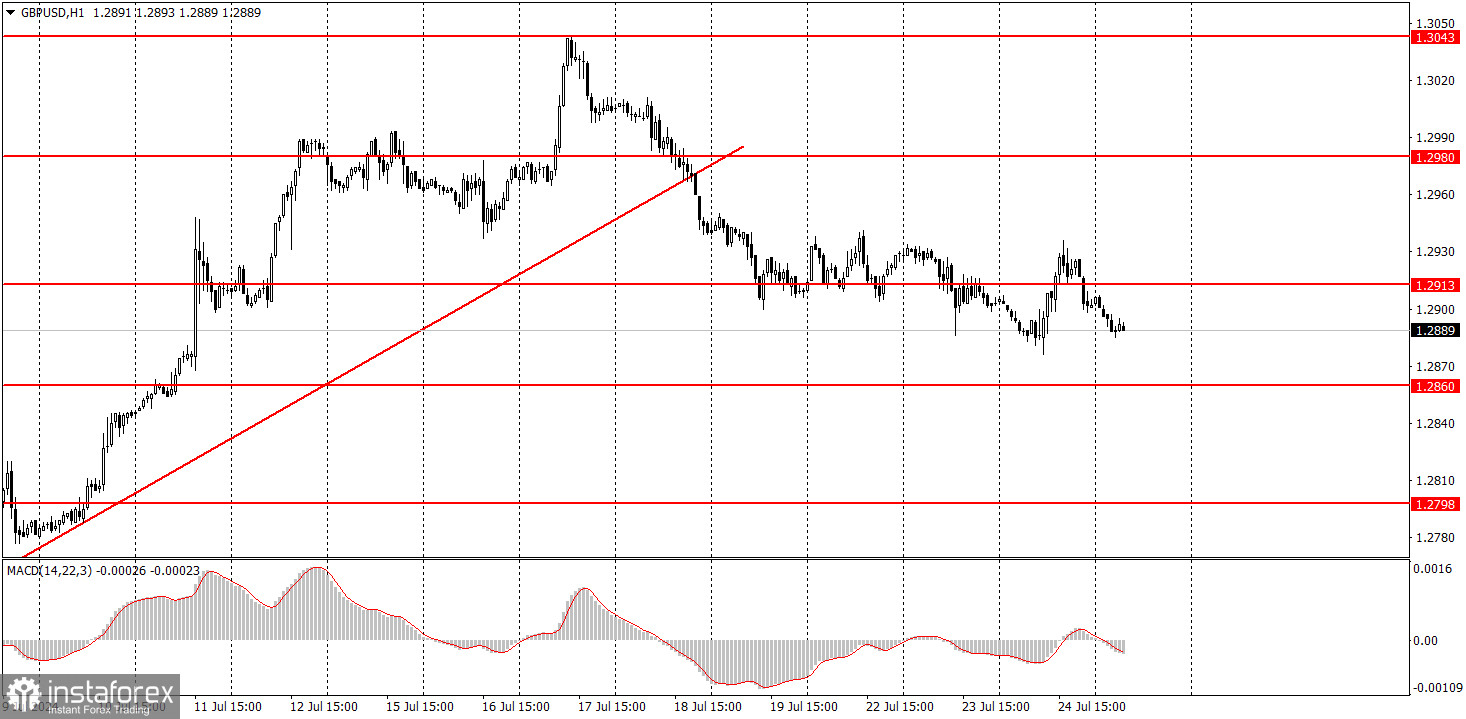
In the hourly timeframe, the GBP/USD pair finally has a chance of at least a minor decline. The pair has breached the ascending trendline, so we might see some correction. Ideally, the pound should drop by at least 400-500 pips. The market has already accounted for all growth factors multiple times, the dollar is undervalued, and the Bank of England may start lowering its rates in the near future.
On Thursday, beginners may trade from the 1.2913 level. A sell signal was formed yesterday, so short positions remain valid. If today's U.S. data does not pressure the dollar, the pair may continue to fall, but it is unlikely to be strong.
The key levels to consider on the 5M timeframe are 1.2605-1.2633, 1.2684-1.2693, 1.2748, 1.2791-1.2798, 1.2848-1.2860, 1.2913, 1.2980-1.2993, 1.3043, 1.3102-1.3107, and 1.3145. No significant events are scheduled in the UK today, but the U.S. will release important reports on durable goods orders and second-quarter GDP.
1) The strength of a signal is determined by the time it took for the signal to form (bounce or level breakthrough). The shorter the time required, the stronger the signal.
2) If two or more trades around a certain level are initiated based on false signals, subsequent signals from that level should be ignored.
3) In a flat market, any currency pair can produce multiple false signals or none at all. In any case, it's better to stop trading at the first signs of a flat market.
4) Trades should be opened between the start of the European session and mid-way through the U.S. session. All trades must be closed manually after this period.
5) In the hourly time frame, trades based on MACD signals are only advisable amidst substantial volatility and an established trend, confirmed either by a trendline or trend channel.
6) If two levels are too close to each other (from 5 to 20 pips), they should be considered as a support or resistance zone.
7) After moving 15 pips in the intended direction, the Stop Loss should be set to break-even.
Support and Resistance price levels can serve as targets when buying or selling. You can place Take Profit levels near them.
Red lines represent channels or trend lines that depict the current trend and indicate the preferred trading direction.
The MACD (14,22,3) indicator, encompassing both the histogram and signal line, acts as an auxiliary tool and can also be used as a source of signals.
Important speeches and reports (always noted in the news calendar) can profoundly influence the price dynamics. Hence, trading during their release calls for heightened caution. It may be reasonable to exit the market to prevent abrupt price reversals against the prevailing trend.
Beginners should always remember that not every trade will yield profit. Establishing a clear strategy, coupled with effective money management, is key to long-term success in trading.
Dzięki analizom InstaForex zawsze będziesz na bieżące z trendami rynkowymi! Zarejestruj się w InstaForex i uzyskaj dostęp do jeszcze większej liczby bezpłatnych usług dla zyskownego handlu.


