 Anuluj
Warunki handlowe
Narzędzia


EUR/USD
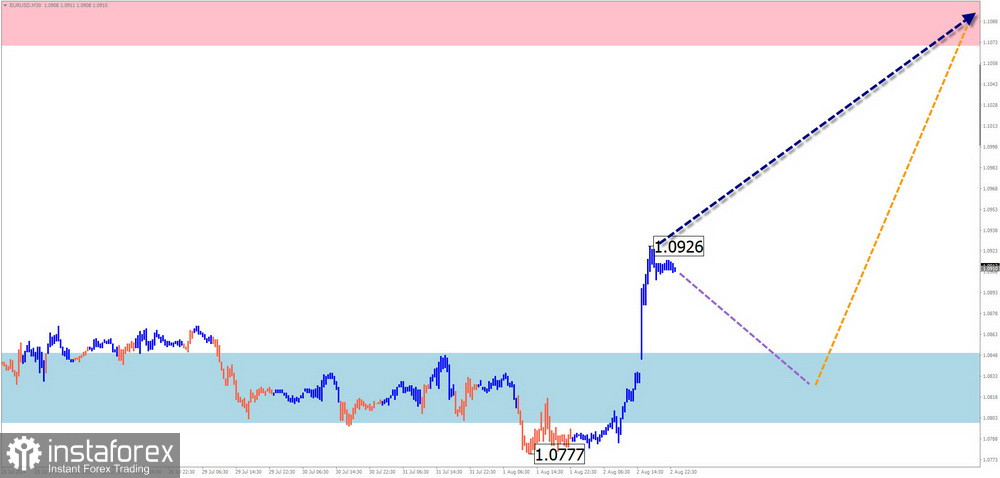
Analysis: The direction of price movement in the main euro pair since September last year has been determined by an upward wave that started in mid-April. From the lower boundary of a powerful resistance zone since the middle of last month, a bearish price movement phase began. The upward segment from August 1st has reversal potential and could be the beginning of the final part of the wave.
Forecast: The upcoming week is expected to continue the overall sideways price movement within the channel between the nearest counter zones. After likely pressure on the support zone, a course change and an upward price movement towards the resistance zone can be expected.
Potential Reversal Zones
Resistance:
Support:
Recommendations:
Sales: Conditions for selling the euro in the coming days will not be present.
Purchases: Can be used in trading after signals for purchasing the instrument appear in the support zone area. Consider the limited potential of the upcoming rise.
USD/JPY
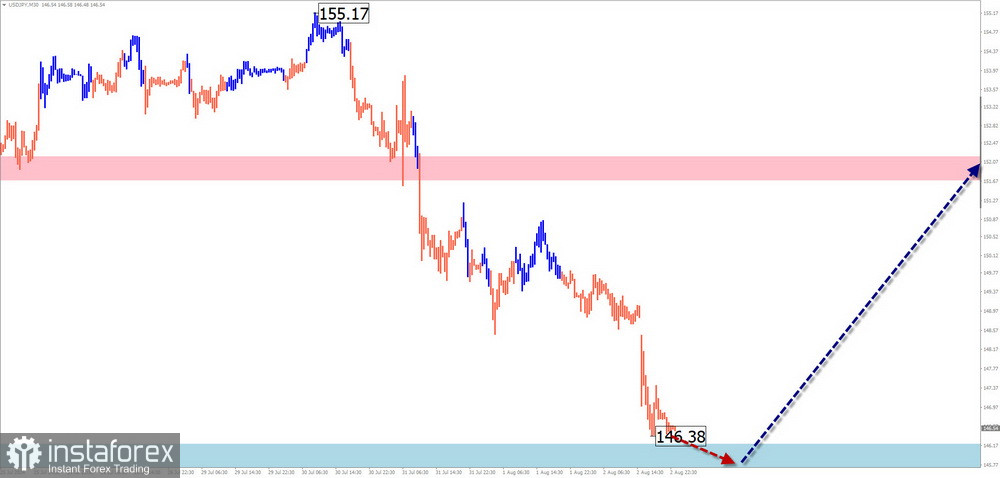
Analysis: The trend direction of the main Japanese yen pair since December last year is set by an upward wave. Since the beginning of May, a corrective wave construction in the form of an extended flat correction has been forming on the chart. To date, the structure of this wave looks completed. The price has entered the boundaries of a powerful potential reversal zone, but no signals of an imminent course change are observed on the chart.
Forecast: The most likely scenario for the upcoming week is a general sideways price movement in the Japanese yen. In the first few days, pressure on the support zone is possible. A temporary breach of this zone's lower boundary is possible. Afterwards, a reversal can be expected. The upper boundary of the expected weekly movement is demonstrated by the calculated resistance.
Potential Reversal Zones
Resistance:
Support:
Recommendations:
Sales: Conditions for transactions are unfavorable. They may be unprofitable.
Purchases: Remain irrelevant until confirmed signals appear in the support zone area.
GBP/JPY
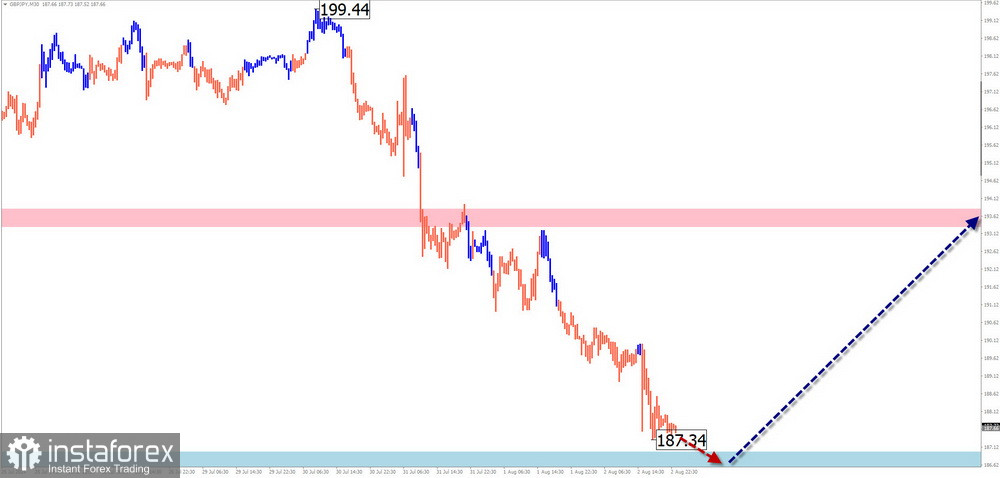
Analysis: Over the past one and a half years, the quotes of the British pound have consistently risen relative to the Japanese yen. Along the lower boundary of a powerful resistance since mid-July, the price forms a corrective segment. The extremes of this segment form an extended flat on the chart. The price has reached the upper boundary of a powerful weekly TF reversal zone. No signals of an imminent reversal are observed on the chart.
Forecast: At the beginning of the upcoming week, the price movement of the pair is likely to be predominantly horizontal. Pressure on the support zone is possible. In the following days, a change of direction and the start of price growth, up to the resistance zone, can be expected.
Potential Reversal Zones
Resistance:
Support:
Recommendations:
Sales: No conditions for transactions.
Purchases: Not relevant until buying signals appear in the support zone area on your trading systems.
USD/CAD
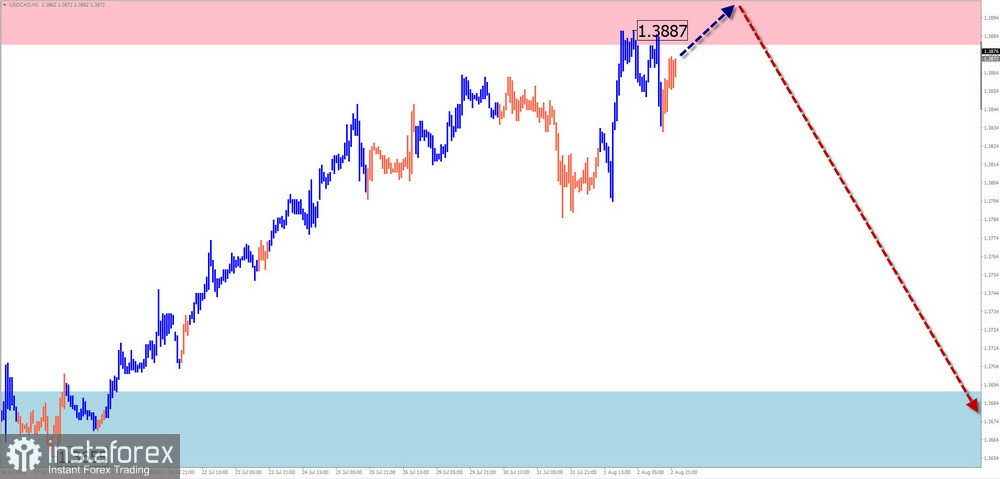
Analysis: The chart of the major Canadian dollar pair continues an upward wave. In its structure since mid-April, a corrective counter-movement in the form of an extended flat has been developing. Its unfinished part upward started on July 11th. The structure of this wave lacks the final segment.
Forecast: In the near weekly period, the continuation of the upward movement is expected until its complete conclusion in the resistance zone area. By the end of the week, the probability of a reversal and the resumption of price reduction increases.
Potential Reversal Zones
Resistance:
Support:
Recommendations:
Sales: No conditions for transactions.
Purchases: Possible within intraday by fractional volume when confirmed signals are present.
NZD/USD
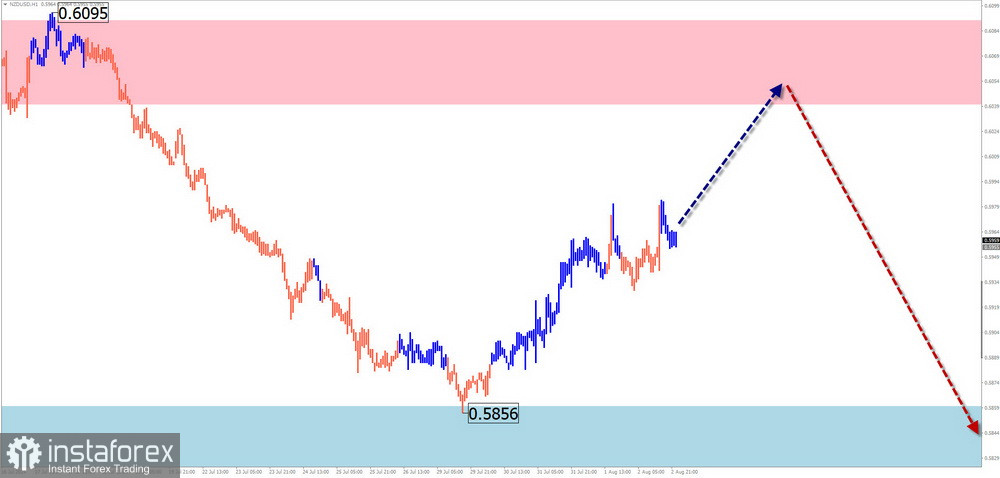
Brief Analysis: Since December last year, the quotes of the major New Zealand dollar have been moving in a downward direction. The unfinished segment according to the main trend counts from June 12th. The pair's quotes have reached strong support, from which they have started to form a counter movement segment.
Forecast for the Week: In the first half of the upcoming week, a predominantly sideways course of the pair's movement, with an upward vector, is most likely. Growth is possible up to the boundaries of the resistance zone. Afterwards, the price awaits a change of direction and the resumption of the decrease.
Potential Reversal Zones
Resistance:
Support:
Recommendations:
Purchases: This will be possible by fractional volume within individual sessions. Risky and may be unprofitable.
Sales: No conditions for transactions until confirmed reversal signals appear in the resistance zone area.
EUR/GBP
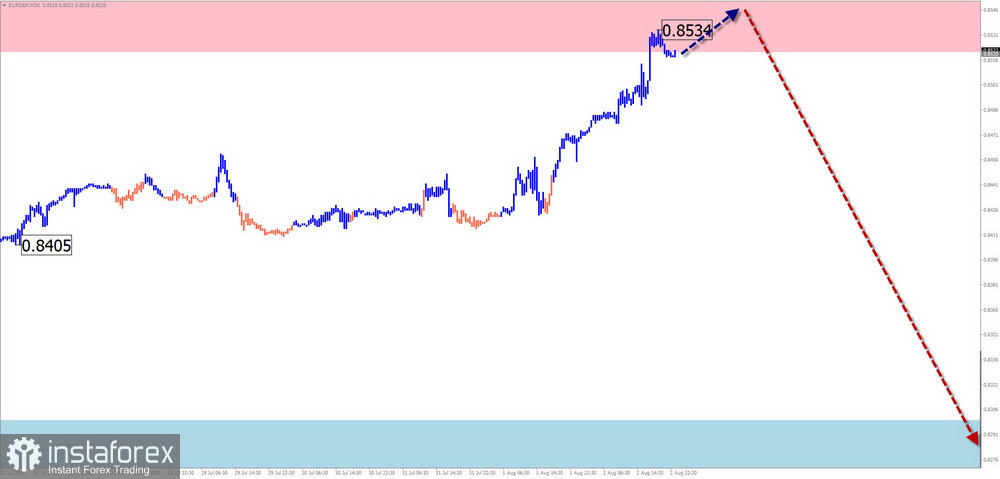
Brief Analysis: The downward wave of the EUR/GBP pair that started in September last year continues its movements in a sideways plane. Analysis of the structure shows that the middle part of the wave (B) from June 14th is nearing completion. The correction structure is close to completion. After its completion, the decrease will continue.
Forecast for the Week: At the beginning of the upcoming week, pressure on the resistance zone is likely, with the transition of the price movement into a sideways plane. Closer to the weekend, the likelihood of activation and resumption of the price movement downward increases.
Potential Reversal Zones
Resistance:
Support:
Recommendations:
Purchases: Do not have potential.
Sales: Will become relevant after corresponding confirmed signals appear in the resistance zone area on your trading systems.
Gold
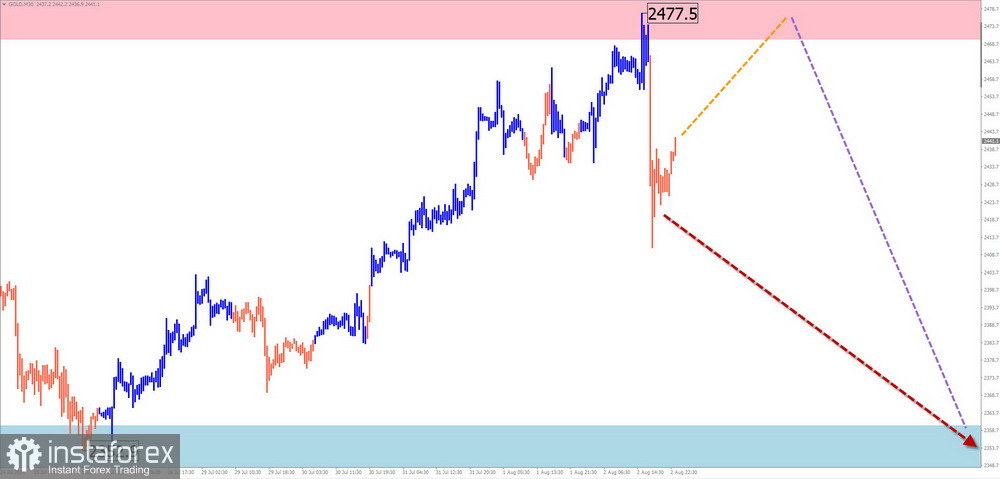
Analysis: The unfinished bullish wave pattern of the gold chart has been counting since September last year. Since mid-March, quotes have been forming a corrective part (B), in the form of an extended flat. Analysis of the structure of this wave shows its incompleteness. In the resistance zone area, the lower boundary of resistance of the weekly TF passes.
Forecast: In the first half of the upcoming week, repeated pressure on the resistance is expected. Then, the formation of a reversal and a change in the direction of movement, with a decrease to the support zone, can be expected.
Potential Reversal Zones
Resistance:
Support:
Recommendations:
Purchases: Consider the limited potential for the upcoming rise. Transactions are better conducted within sessions by fractional volume.
Sales: Conditions for such transactions may arise closer to the weekend.
Notes: In simplified wave analysis (SWA), all waves consist of 3 parts (A-B-C). The last, unfinished wave is analyzed on each TF. Dotted lines show expected movements.
Attention: The wave algorithm does not account for the duration of instrument movements over time!
Dzięki analizom InstaForex zawsze będziesz na bieżące z trendami rynkowymi! Zarejestruj się w InstaForex i uzyskaj dostęp do jeszcze większej liczby bezpłatnych usług dla zyskownego handlu.

