 Anuluj
Warunki handlowe
Narzędzia


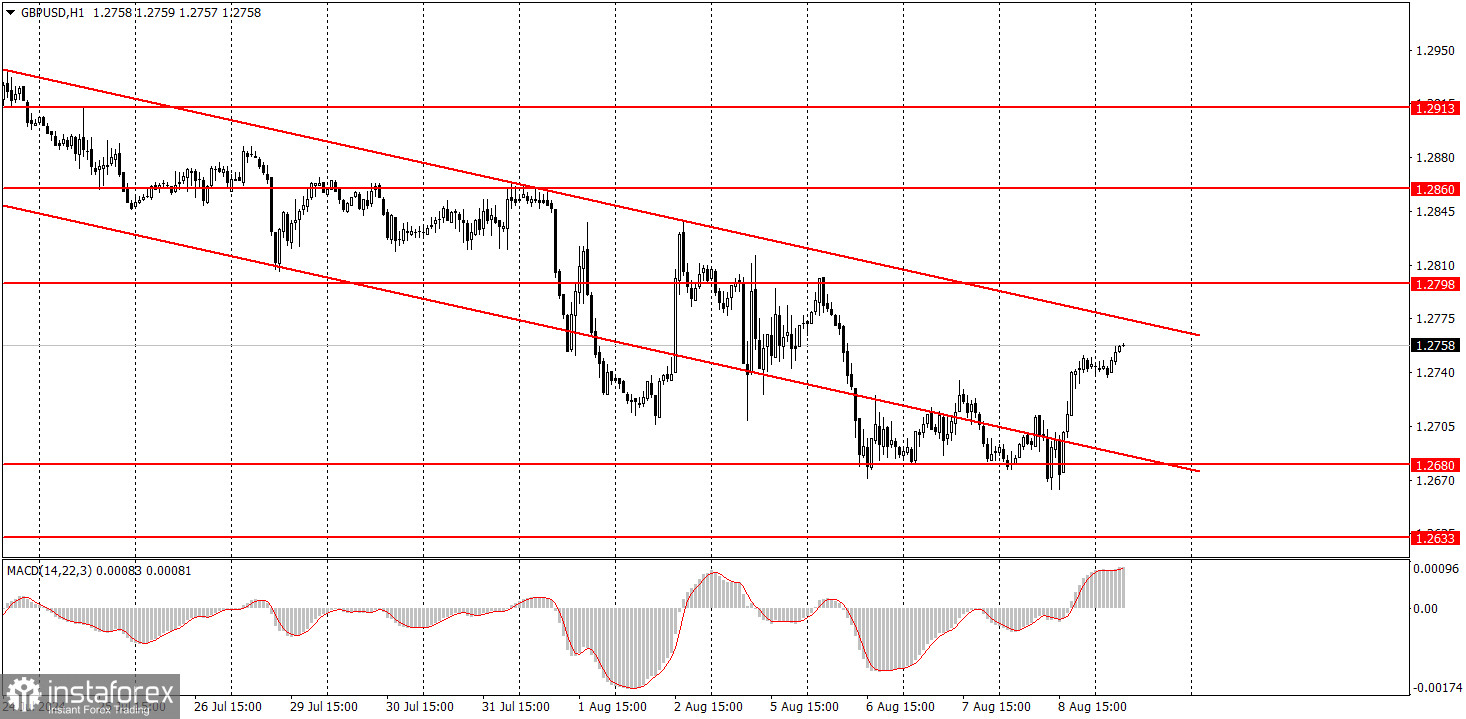
On Thursday, the GBP/USD pair failed to surpass 1.2680 for the fourth consecutive time and began the correction we discussed at the beginning of the week. The price remains within a descending channel; thus, the downward trend remains intact. A rebound from the channel's upper boundary may trigger a new decline in the British currency. However, the pound sterling has been falling for three weeks, so we could expect a more substantial correction. Movements are now purely technical, with no fundamental or macroeconomic background. We believe the pair's decline will continue in the medium term, as it has been rising for three straight months and needs a deep bearish correction. Besides, the fundamental background supports the oversold dollar much more than the overbought pound.
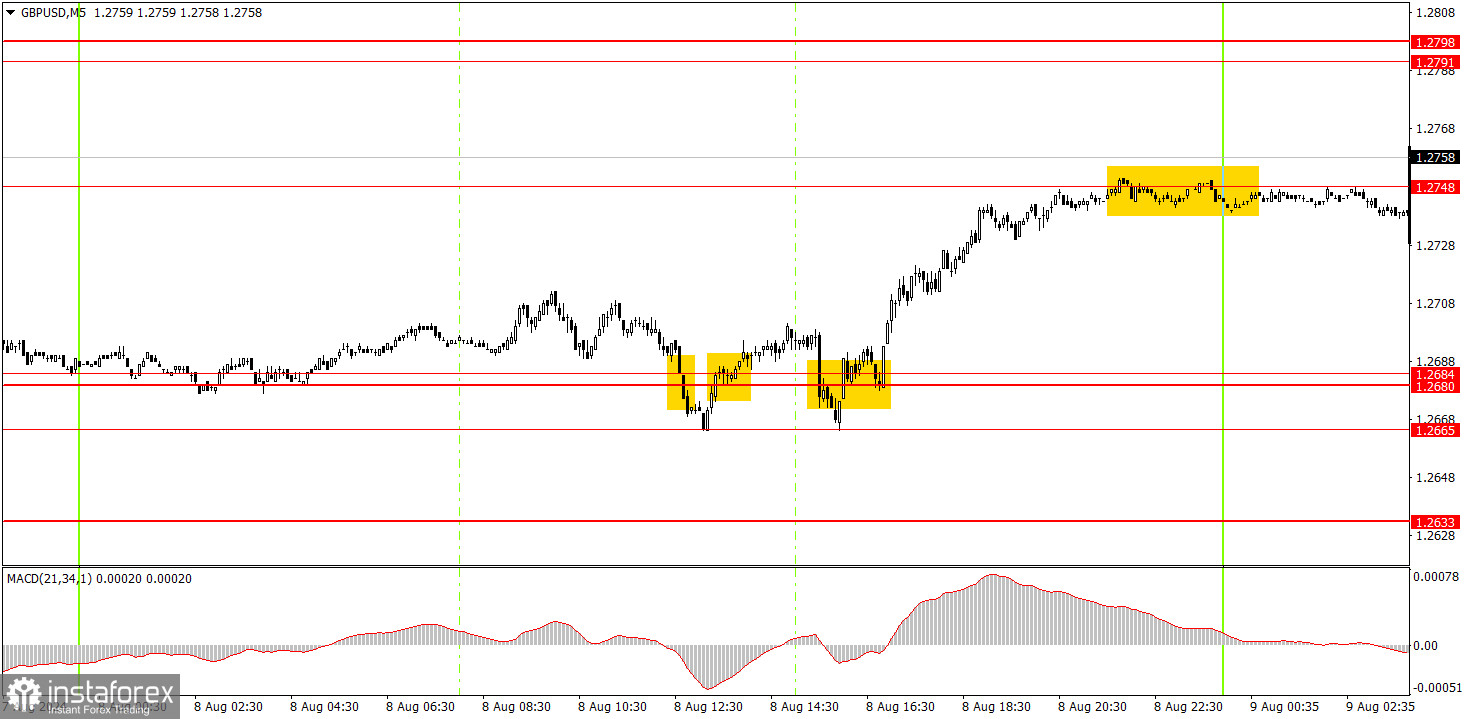
Several signals were formed in the 5-minute time frame on Thursday, but unfortunately, near 1.2680-1.2684, traders were a bit lost and repeatedly tried to break through it, which generated two false sell signals. The upward movement eventually started, but traders might have already been disillusioned with the current movement and missed the last buy signal by that time. We added another support level to this area – 1.2665. Last night, the price consolidated above 1.2748, so today, the pound may continue to rise with the target of 1.2791-1.2798.
GBP/USD has a good chance of sustaining its downtrend, but it is currently correcting in the hourly time frame. The British pound is still overbought, the dollar is undervalued, and the Bank of England has started lowering its borrowing costs—what more is needed for the British currency to fall? Thus, after the correction ends, we expect a new round of decline for the pound sterling.
On Friday, beginners can trade from 1.2748. Since the price has surpassed this level, we can expect the pair to sustain its growth with a target of 1.2791-1.2798. However, today's volatility is likely to be low again.
The key levels to consider on the 5M timeframe are 1.2547, 1.2605-1.2633, 1.2684-1.2693, 1.2748, 1.2791-1.2798, 1.2848-1.2860, 1.2913, 1.2980-1.2993, 1.3043, 1.3102-1.3107, 1.3145. No significant events are scheduled for Friday in the UK or the US, so nothing should prevent the continuation of the upward correction.
1) The strength of a signal is determined by the time it took for the signal to form (bounce or level breakthrough). The shorter the time required, the stronger the signal.
2) If two or more trades around a certain level are initiated based on false signals, subsequent signals from that level should be ignored.
3) In a flat market, any currency pair can produce multiple false signals or none at all. In any case, it's better to stop trading at the first signs of a flat market.
4) Trades should be opened between the start of the European session and mid-way through the U.S. session. All trades must be closed manually after this period.
5) In the hourly time frame, trades based on MACD signals are only advisable amidst substantial volatility and an established trend, confirmed either by a trendline or trend channel.
6) If two levels are too close to each other (from 5 to 20 pips), they should be considered as a support or resistance zone.
7) After moving 15 pips in the intended direction, the Stop Loss should be set to break-even.
Support and Resistance price levels: targets when opening long or short positions. You can place Take Profit levels near them.
Red lines represent channels or trend lines that depict the current trend and indicate the preferred trading direction.
The MACD (14,22,3) indicator, encompassing both the histogram and signal line, acts as an auxiliary tool and can also be used as a source of signals.
Important speeches and reports (always noted in the news calendar) can profoundly influence the price dynamics. Hence, trading during their release calls for heightened caution. It may be reasonable to exit the market to prevent abrupt price reversals against the prevailing trend.
Beginners should always remember that not every trade will yield profit. Establishing a clear strategy, coupled with effective money management, is key to long-term success in trading.
Dzięki analizom InstaForex zawsze będziesz na bieżące z trendami rynkowymi! Zarejestruj się w InstaForex i uzyskaj dostęp do jeszcze większej liczby bezpłatnych usług dla zyskownego handlu.

