 Anuluj
Warunki handlowe
Narzędzia


On the weekly chart, the price consolidated above the MACD indicator line. The probability of a retest of the target level of 1.1010 or reaching 1.1043 has slightly increased. At the same time, we observe the formation of a very extended wedge on the Marlin oscillator.
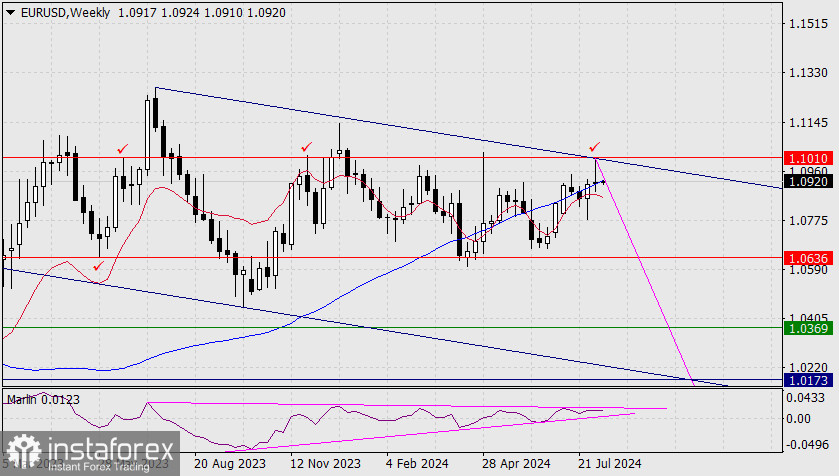
Long wedges rarely precede strong, sustained movements; however, the price is clearly on the brink of significant changes that could take it out of the prolonged range of 1.0636-1.1010. If the price breaks below this range, the target levels are 1.0369 and 1.0173.
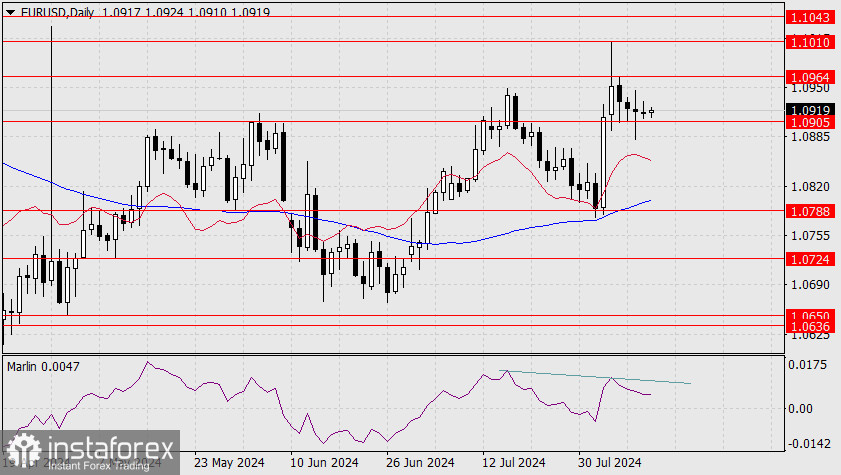
On the daily chart, the price struggles with the support at 1.0905, aided by divergence with the Marlin oscillator. Therefore, a weekly close in the form of a Doji could also be a false signal. A daily close below the 1.0905 level would indicate the development of the main bearish scenario. After all, the opening of a new weekly candle occurred below the MACD line.
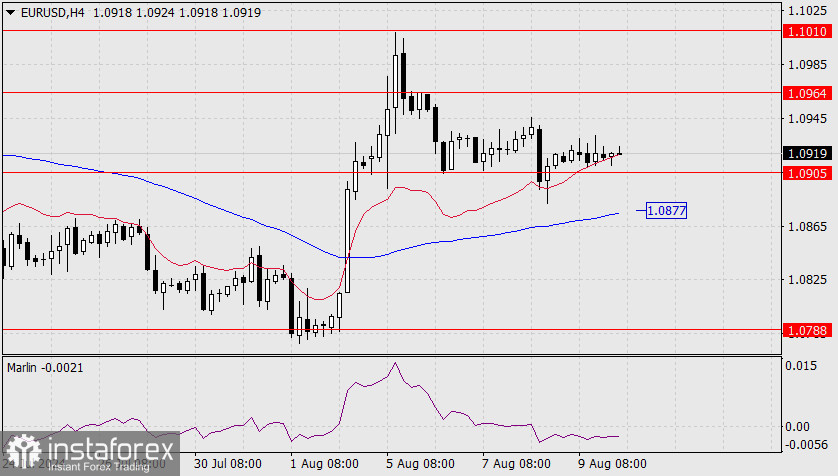
On the 4-hour chart, the price is currently moving above the balance indicator line (red moving average). If the consolidation above 1.0905 continues, the balance line will be above the price. The signal line of the Marlin oscillator is moving sideways in negative (descending) territory, which increases the likelihood of the price dropping below support in this time frame. Moving below the MACD line (1.0877) would confirm the price's intention to reach the 1.0788 target.
Dzięki analizom InstaForex zawsze będziesz na bieżące z trendami rynkowymi! Zarejestruj się w InstaForex i uzyskaj dostęp do jeszcze większej liczby bezpłatnych usług dla zyskownego handlu.


