 Anuluj
Warunki handlowe
Narzędzia


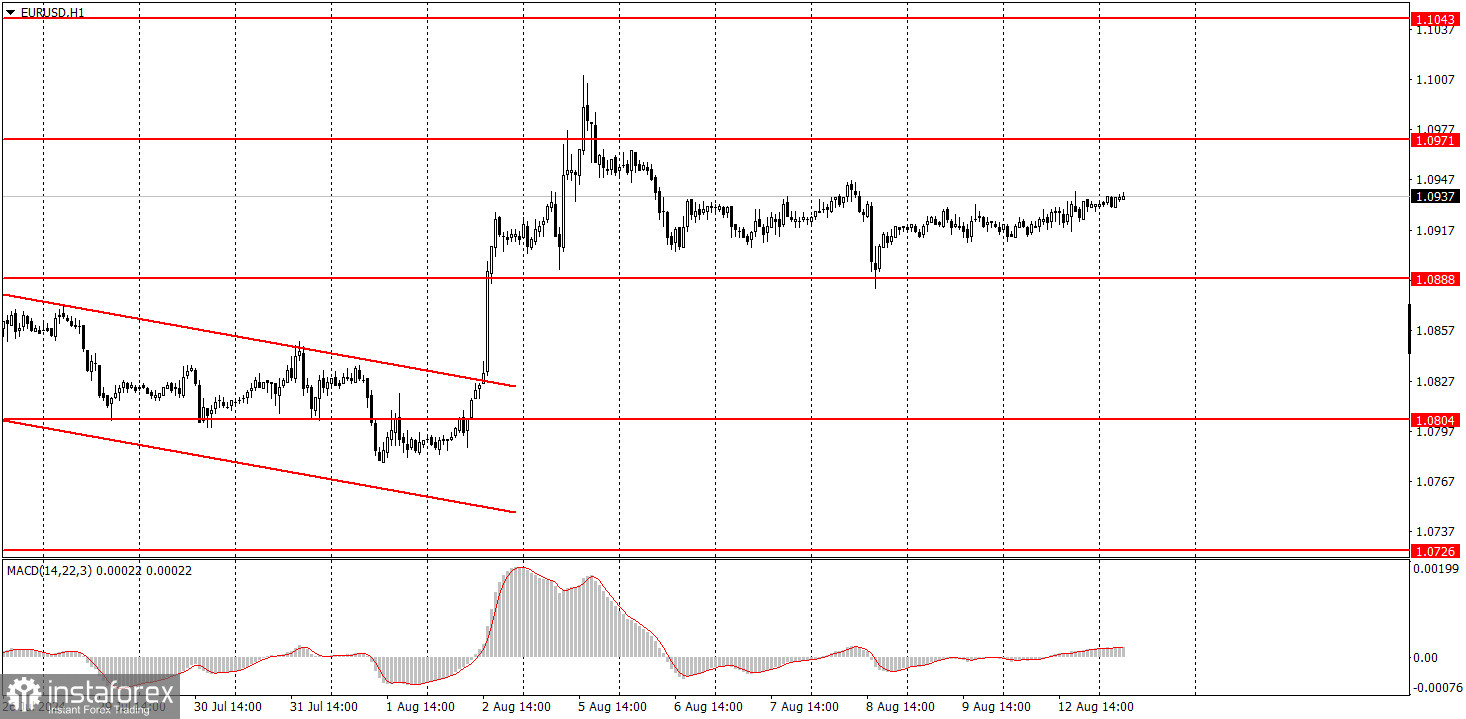
On Monday, the EUR/USD pair showed low volatility and unwillingness to trade. This was precisely the kind of movement we anticipated, as no significant events were scheduled for the first trading day of the week, and no events over the weekend could have impacted market sentiment. Mondays are often "half-holidays" in the forex market. Thus, the current picture is as follows: the pair corrected to the 1.0888 level last week and perfectly bounced off it. Formally, the upward trend remains intact, but it's important to remember that we have been in a range-bound phase for seven months now. Last week, the price also touched the upper boundary of the range at 1.1000. Therefore, there is a high probability of moving towards the lower boundary at 1.0600.
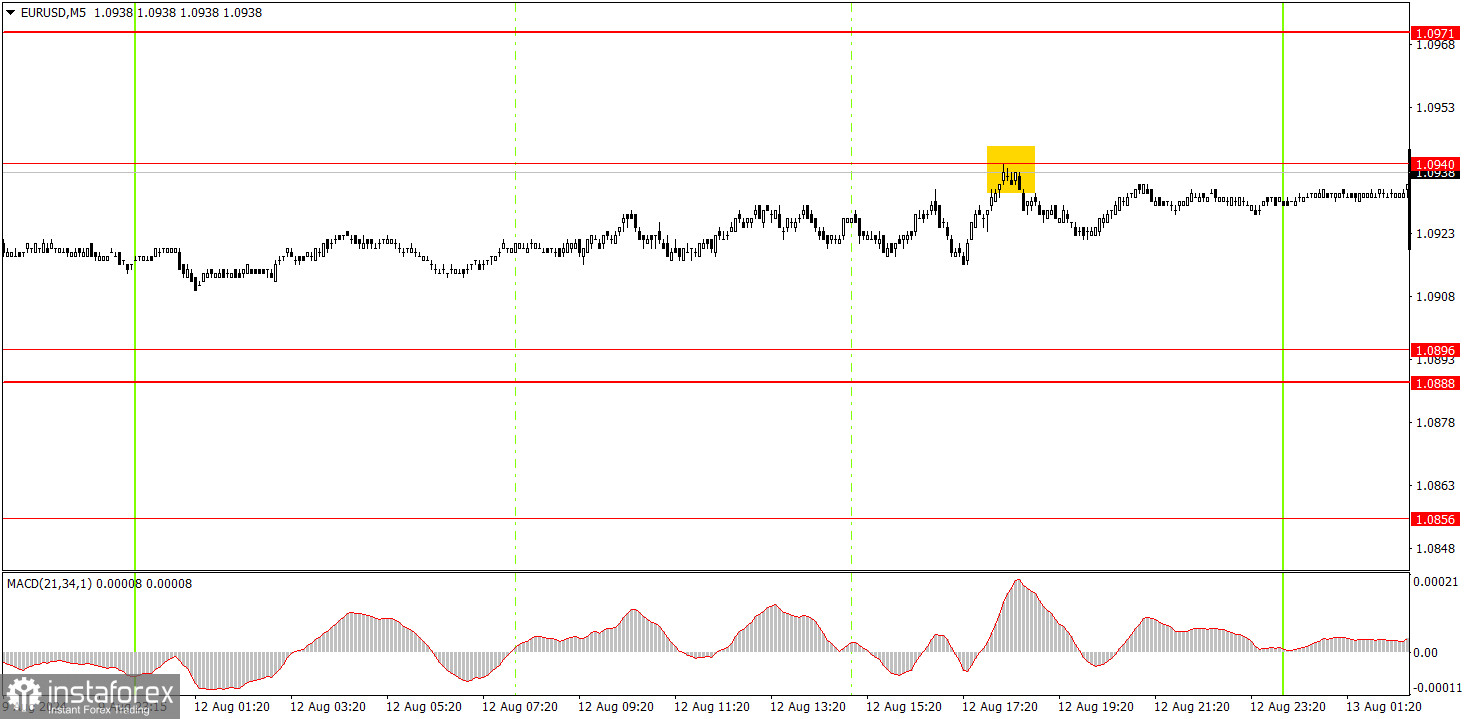
In the 5-minute chart, one sell signal was generated near 1.0940 on Monday. However, it was formed quite late, and with volatility of around 30 pips, entering the market at that time made no sense.
EUR/USD broke the short-term downward trend in the hourly time frame but couldn't rise above the 1.10 level. We believe the euro has fully factored in all the bullish factors, so we do not expect the upward movement to continue. The pair remains flat in the 1.06-1.10 range in the 24-hour time frame. There are currently no reasons to leave this range. We still expect the euro to fall, as the European Central Bank has begun easing monetary policy while the Federal Reserve has not.
On Tuesday, novice traders might stay in long positions after the price rebounds from the 1.0888-1.0896 area. However, it reached the nearest target of 1.0940. Since volatility has again dropped to low levels, any signal may take several days to play out.
The key levels to consider on the 5M time frame are 1.0526, 1.0568, 1.0611, 1.0678, 1.0726-1.0733, 1.0797-1.0804, 1.0838-1.0856, 1.0888-1.0896, 1.0940, 1.0971, 1.1011, 1.1043, 1.1091. On Tuesday, reports on economic expectations in Germany and the EU from ZEW are scheduled in the Eurozone. In the US, the Producer Price Index will be released today. These are secondary reports, but they could move the market from its current standstill.
1) The strength of a signal is determined by the time it took for the signal to form (bounce or level breakthrough). The shorter the time required, the stronger the signal.
2) If two or more trades around a certain level are initiated based on false signals, subsequent signals from that level should be ignored.
3) In a flat market, any currency pair can produce multiple false signals or none at all. In any case, it's better to stop trading at the first signs of a flat market.
4) Trades should be opened between the start of the European session and mid-way through the U.S. session. All trades must be closed manually after this period.
5) In the hourly time frame, trades based on MACD signals are only advisable amidst substantial volatility and an established trend, confirmed either by a trendline or trend channel.
6) If two levels are too close to each other (from 5 to 20 pips), they should be considered as a support or resistance zone.
7) After moving 15 pips in the intended direction, the Stop Loss should be set to break-even.
Support and Resistance price levels: targets when opening long or short positions. You can place Take Profit levels near them.
Red lines represent channels or trend lines that depict the current trend and indicate the preferred trading direction.
The MACD (14,22,3) indicator, encompassing both the histogram and signal line, acts as an auxiliary tool and can also be used as a source of signals.
Important speeches and reports (always noted in the news calendar) can profoundly influence the price dynamics. Hence, trading during their release calls for heightened caution. It may be reasonable to exit the market to prevent abrupt price reversals against the prevailing trend.
Beginners should always remember that not every trade will yield profit. Establishing a clear strategy, coupled with effective money management, is key to long-term success in trading.
Dzięki analizom InstaForex zawsze będziesz na bieżące z trendami rynkowymi! Zarejestruj się w InstaForex i uzyskaj dostęp do jeszcze większej liczby bezpłatnych usług dla zyskownego handlu.


