 Anuluj
Warunki handlowe
Narzędzia


W poniedziałek para GBP/USD wykazała ruch spadkowy, którego można było uniknąć. Jednak w zeszłym tygodniu cena przekroczyła linię trendu wzrostowego, a funt brytyjski jest nadal wykupiony. Dlatego też, biorąc pod uwagę wszystkie czynniki, brytyjska waluta powinna jedynie spaść. Jednak spadki na parze w piątek i poniedziałek pokazują pewne oznaki gotowości rynku do sprzedaży, a nie kupna. A ostatnio zdarzało się to niezwykle rzadko.
W tym tygodniu w Wielkiej Brytanii zostanie opublikowanych kilka ważnych raportów, ale mało prawdopodobne jest, aby miały one drastyczny wpływ na nastroje rynkowe. Jedynym ważnym raportem jest inflacja w USA, po której można i należy spodziewać się niespodzianek. Przypomnijmy, że rynek kilka razy reagował masową wyprzedażą dolara, gdy rzeczywista stopa inflacji była nawet o 0,1% niższa od prognozowanej. Jest oczywiste, że Rezerwa Federalna rozpocznie łagodzenie polityki pieniężnej na następnym posiedzeniu, ale rynek nadal dopuszcza możliwość, że obniżka ta może wynieść nawet 0,5%.
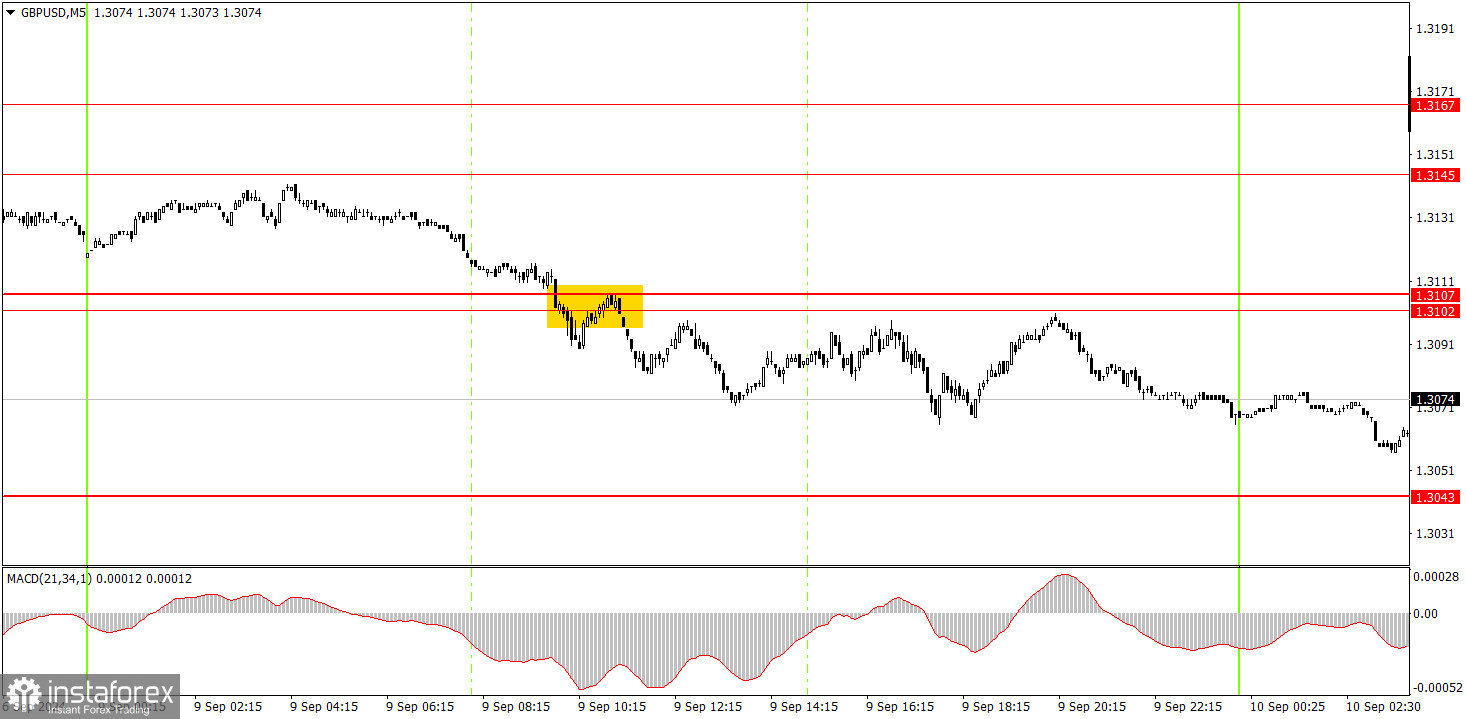
W poniedziałek w 5-minutowym przedziale czasowym uformował się jeden sygnał handlowy. Podczas sesji europejskiej cena skonsolidowała się poniżej obszaru 1,3102-1,3107, po czym udało jej się przesunąć w dół o około 30-40 pipsów. Nie osiągnęła najbliższego poziomu docelowego, ale ruch spadkowy może trwać nadal. Dlatego traderzy mogli wczoraj otworzyć krótką pozycję, a wieczorem ją zamknąć lub poczekać przynajmniej na osiągnięcie poziomu 1,3043.
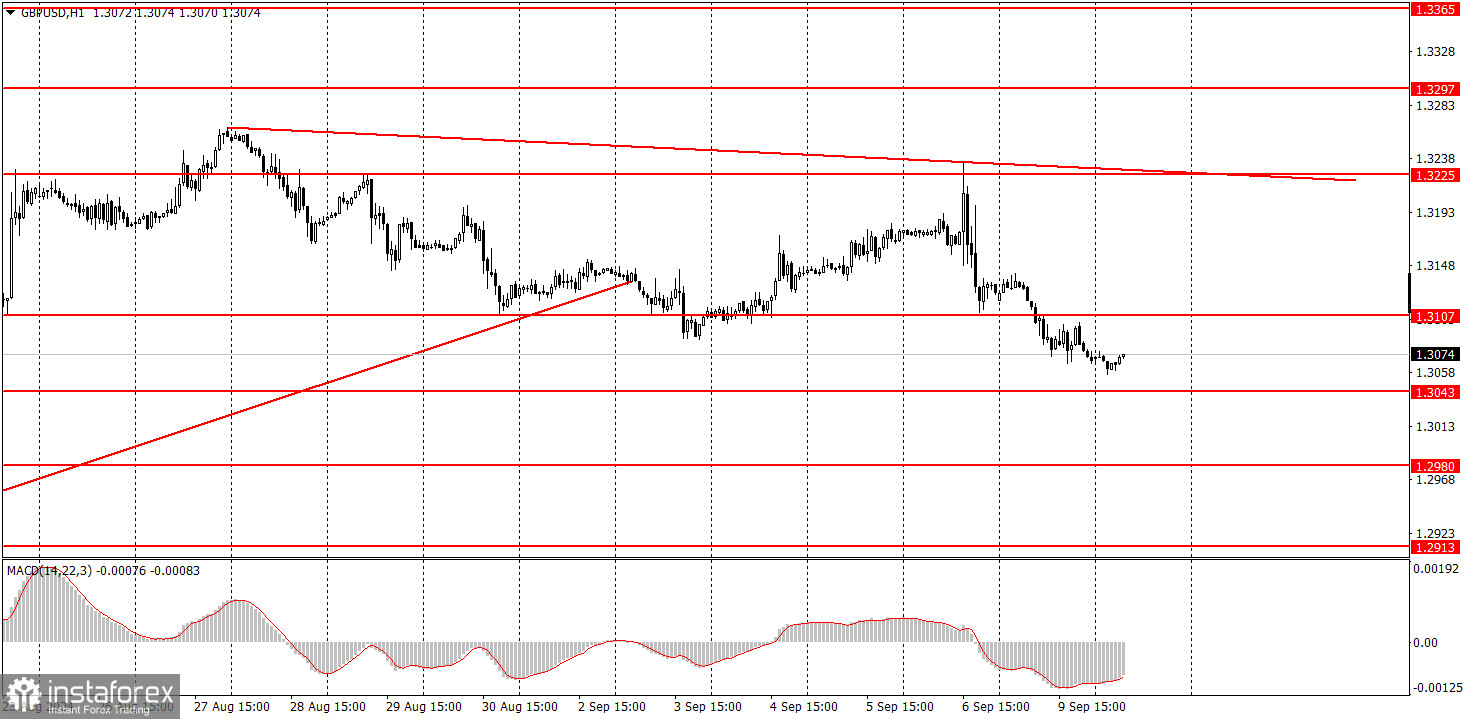
W godzinowym przedziale czasowym para GBP/USD ma duże szanse na wznowienie globalnego trendu spadkowego lub przynajmniej na odnotowanie pewnego spadku. Funt brytyjski pozostaje wykupiony, dolar jest niedowartościowany, a rynek nadal jest bardziej skłonny do sprzedaży dolara niż do jego kupna. Jak dotąd funt wykazuje jedynie niewielką korektę spadkową i jest za wcześnie, aby mówić o pełnym trendzie spadkowym.
We wtorek para może poruszać się w dowolnym kierunku, ale prawdopodobnie będzie to ruch płaski. W zeszłym tygodniu nie było nowych powodów, aby dolar wzrósł, chociaż pozostaje nadmiernie wyprzedany.
Kluczowe poziomy w przedziale 5M to: 1,2605-1,2633, 1,2684-1,2693, 1,2748, 1,2791-1,2798, 1,2848-1,2860, 1,2913, 1,2980-1,2993, 1,3043, 1,3102-1,3107, 1,3145-1,3167, 1,3225, 1,3272 i 1,3310. We wtorek w Wielkiej Brytanii zostaną opublikowane raporty dotyczące bezrobocia, płac i zmian w liczbie bezrobotnych. Dane te mogą jedynie wywołać lokalną reakcję rynkową.
1) Siła sygnału jest określana przez czas potrzebny na jego uformowanie (odbicie lub wybicie z poziomu). Im szybciej powstaje sygnał, tym jest on silniejszy.
2) Jeśli dwie lub więcej pozycji zostało otwartych w pobliżu pewnego poziomu w oparciu o fałszywy sygnał, wszystkie kolejne sygnały na tym poziomie należy zignorować.
3) Podczas handlu płaskiego para może tworzyć wiele fałszywych sygnałów lub wcale ich nie tworzyć. W każdym razie lepiej przerwać handel przy pierwszych oznakach ruchu bocznego.
4) Transakcje powinny być otwierane w okresie od rozpoczęcia sesji europejskiej do połowy sesji amerykańskiej, a wszystkie pozycje powinny być ręcznie zamykane.
5) W godzinowym przedziale handlowym można handlować za pomocą sygnałów ze wskaźnika MACD tylko przy dużej zmienności i wyraźnym trendzie, który powinien zostać potwierdzony przez linię trendu lub kanał trendu.
6) Jeśli dwa poziomy znajdują się zbyt blisko siebie (od 5 do 20 pipsów), należy je traktować jako poziomy wsparcia lub oporu.
7) Kiedy cena poruszy się we właściwym kierunku o 20 pipsów, należy ustawić Stop Loss na próg rentowności.
Poziomy wsparcia i oporu to poziomy, które służą jako cele przy kupnie lub sprzedaży pary. Możesz umieścić Take Profit w ich pobliżu.
Czerwone linie to kanały lub linie trendu, które wyświetlają aktualny trend i pokazują, w którym kierunku lepiej jest teraz handlować.
Wskaźnik MACD (14, 22, 3) składa się z histogramu i linii sygnału - to wskaźnik pomocniczy, który może być również wykorzystany jako źródło sygnału.
Ważne przemówienia i raporty ekonomiczne, które zawsze można znaleźć w kalendarzu ekonomicznym, mogą poważnie wpłynąć na ruch pary walutowej. Dlatego w momencie ich publikacji zalecamy bardzo ostrożny handel lub wyjście z rynku, aby uniknąć gwałtownych wahań cen.
Początkujący traderzy powinni pamiętać, że nie każda pojedyncza transakcja musi przynosić zyski. Opracowanie jasnej strategii i zarządzanie środkami to klucz do sukcesu w handlu długoterminowym.
Dzięki analizom InstaForex zawsze będziesz na bieżące z trendami rynkowymi! Zarejestruj się w InstaForex i uzyskaj dostęp do jeszcze większej liczby bezpłatnych usług dla zyskownego handlu.


