 Anuluj
Warunki handlowe
Narzędzia


The EUR/USD pair found nothing better, more logical, or reasonable to do on Monday than to continue rising. The descending trendline was breached as if it never existed, and the Ichimoku indicator lines posed no significant obstacle to the price's upward movement. All of this happened against the backdrop of an empty macroeconomic and fundamental events calendar. Once again, all traders could see that the market didn't need any reason to sell the US dollar. Of course, one might say that the upcoming Federal Reserve meeting, where interest rates will be lowered for the first time in a long while, is drawing near. There is no other option. However, the market has been pricing in a Fed rate cut since at least the beginning of 2024. How much longer will this be priced in?
The last barrier is the 1.1137 level, which the market has saved for last. It appears the market decided not to send the dollar into a knockdown on the first day of the week, opting instead to wait out of decorum for the actual Fed meeting. At the moment, it can't be said that the trend has shifted upward, but it cannot be called a downward trend. What the Fed's decision will be, how the market will react, what Fed Chair Jerome Powell's speech will be like, and how much longer the market plans to price in the Fed's monetary easing are tough questions to answer right now.
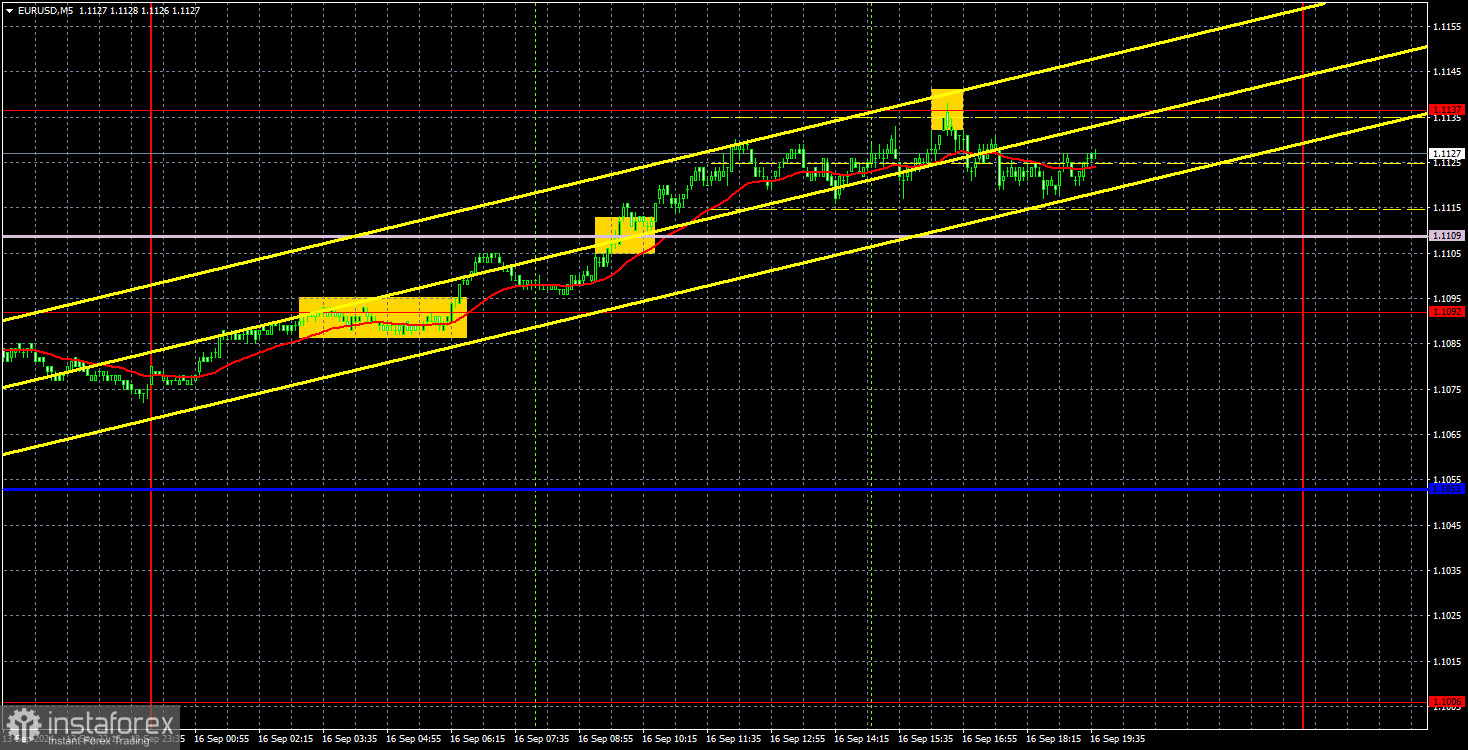
Since yesterday's movement was one-sided, trading was quite pleasant. During the night, a buy signal was formed near the 1.1092 level, followed by the breach of the Senkou Span B line. After that, the 1.1137 level was tested, and the upward movement ended. Volatility wasn't extremely high, but traders could have made around 30 pips on this single trade.
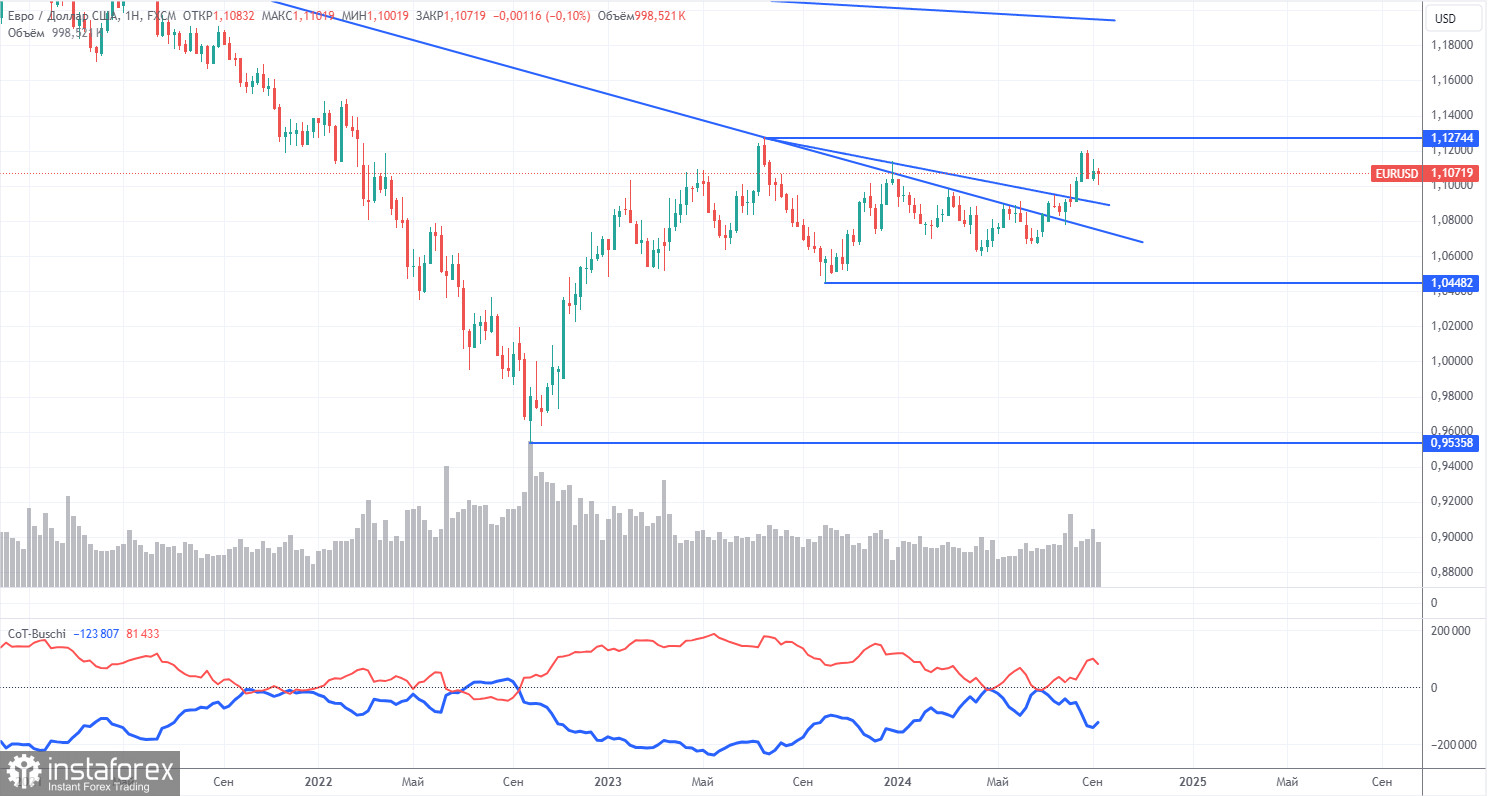
The latest COT report is dated September 10. The illustration above clearly shows that the net position of non-commercial traders has remained bullish for a long time. The bears' attempt to take over failed miserably. The net position of non-commercial traders (red line) declined in the second half of 2023 and early 2024, while commercial traders (blue line) increased. Currently, professional players are again increasing their long positions.
We also still do not see any fundamental factors supporting the strengthening of the euro. Technical analysis indicates that the price is in a consolidation phase—in other words, a flat. In the weekly time frame, it is clear that since December 2022, the pair has been trading between levels 1.0448 and 1.1274. In other words, we have moved from a seven-month flat into an 18-month one.
The red and blue lines are diverging at the moment, indicating that long positions on the euro are increasing. However, such changes cannot be a basis for long-term conclusions within a flat trend. During the last reporting week, the number of long positions in the non-commercial group decreased by 23,100, while the number of short positions fell by 4,500. Accordingly, the net position decreased by 18,600. Nevertheless, the euro still has the potential to fall.
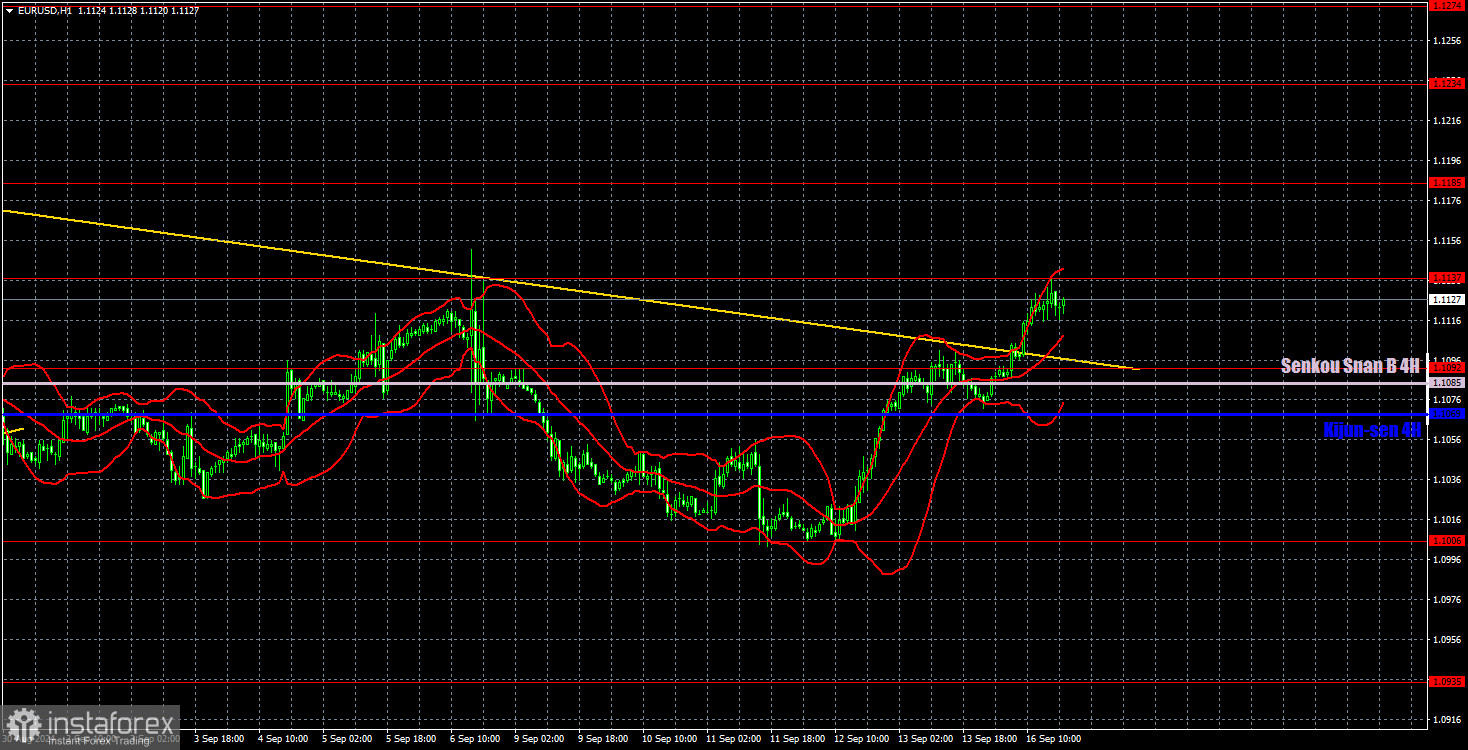
In the hourly time frame, the EUR/USD pair finally has a real chance to end the baseless upward trend, but these chances are quickly fading. The trendline and the Senkou Span B line have been broken. Now, the global uptrend is likely to resume. There's no point in discussing the fundamental and macroeconomic reasons for a new drop in the dollar — they don't exist. However, price movement depends solely on the market itself, and the market can trade in any direction, regardless of the news.
For September 17, we highlight the following levels: 1.0658-1.0669, 1.0757, 1.0797, 1.0843, 1.0889, 1.0935, 1.1006, 1.1092, 1.1137, 1.1185, 1.1234, 1.1274, as well as the Senkou Span B line (1.1085) and Kijun-sen line (1.1069). The Ichimoku indicator lines can move during the day, so this should be considered when identifying trading signals. Remember to set a Stop Loss to break even if the price has moved in the intended direction by 15 pips. This will protect you against potential losses if the signal turns out to be false.
On Tuesday, the ZEW Economic Sentiment Index will be published in the Eurozone, and the US will release reports on industrial production and retail sales. These reports might provoke a reaction of about 20 pips but will not affect the overall market sentiment, which will focus solely on selling the US dollar.
Support and resistance levels: Thick red lines near which the trend may end. They are not sources of trading signals.
Kijun-sen and Senkou Span B lines: These Ichimoku indicator lines, transferred from the 4-hour timeframe to the hourly chart, are strong lines.
Extreme levels: Thin red lines from which the price previously bounced. These provide trading signals.
Yellow lines: Trend lines, trend channels, and other technical patterns.
Indicator 1 on COT charts: The net position size for each category of traders.
Dzięki analizom InstaForex zawsze będziesz na bieżące z trendami rynkowymi! Zarejestruj się w InstaForex i uzyskaj dostęp do jeszcze większej liczby bezpłatnych usług dla zyskownego handlu.

