 Anuluj
Warunki handlowe
Narzędzia


Analysis:
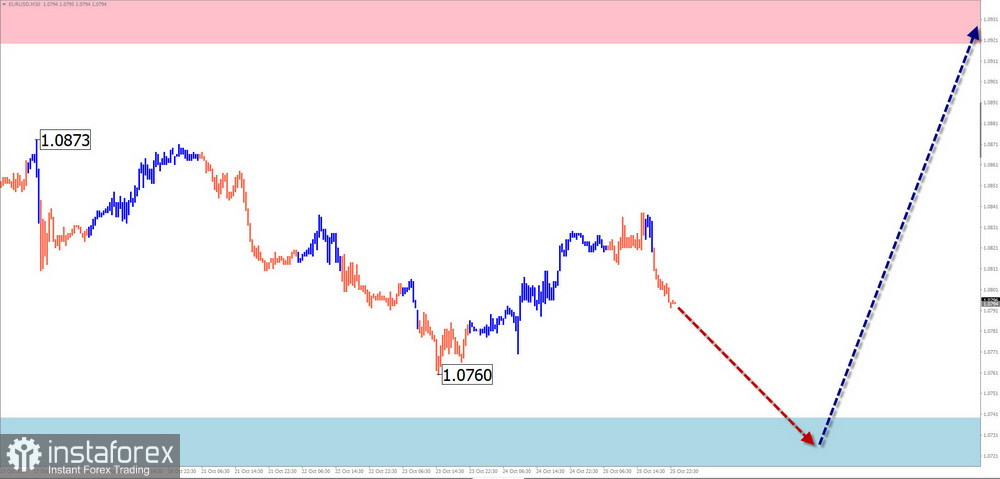
In the short term, the euro's price direction in the EUR/USD pair is driven by the upward wave starting from August 5. This wave has reversal potential, setting the pair's trend towards long-term strengthening. Over the last month, the pair has formed the final part of the wave model (C). Prices are approaching the upper boundary of the preliminary target zone.
Forecast:
At the start of the upcoming week, the euro is expected to continue its downward movement. Around the support zone, price fluctuations may transition to a sideways trend, with a reversal likely later in the week. Key economic news could serve as a timing indicator.
Potential Reversal Zones
Recommendations:
Analysis:
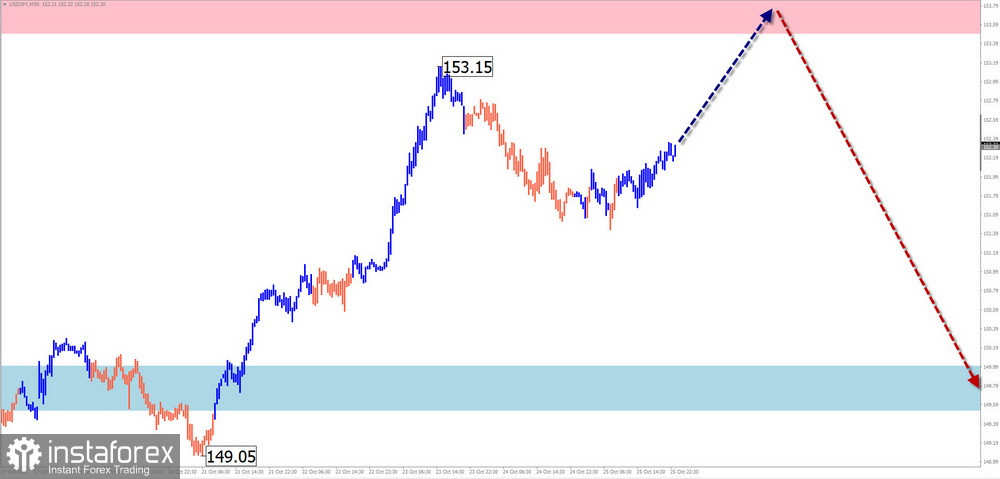
In the short term, the primary trend for the Japanese yen is upward, with the last unfinished segment dating back to September 16. Prices are nearing the potential reversal zone, close to its upper boundary on the weekly chart. No immediate reversal signals are evident.
Forecast:
The price is expected to continue rising towards the resistance zone early in the week, possibly followed by a sideways movement. A directional change and a decline may occur after reaching the upper boundary. The lower boundary of the weekly range provides a probable support zone.
Potential Reversal Zones
Recommendations:
Analysis:
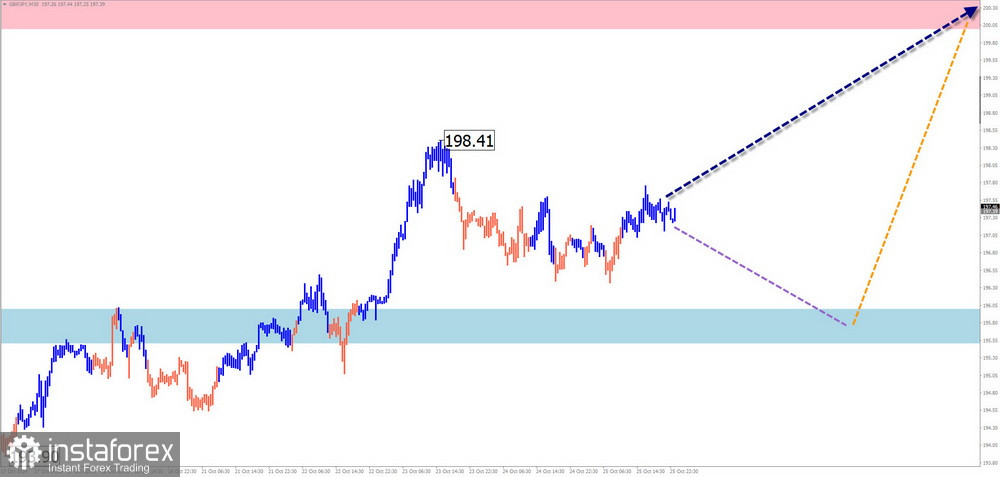
Since early August, an upward wave in the GBP/JPY pair has driven prices towards the lower boundary of a strong weekly resistance zone. The structure of the final part appears complete, though no immediate reversal signals are observed.
Forecast:
A sideways movement with a downward trend is expected in the first half of the upcoming week, likely limited by the support range. A resurgence in buying pressure may follow, potentially driving prices towards the calculated resistance. This activity may coincide with significant economic data releases.
Potential Reversal Zones
Recommendations:
Analysis:
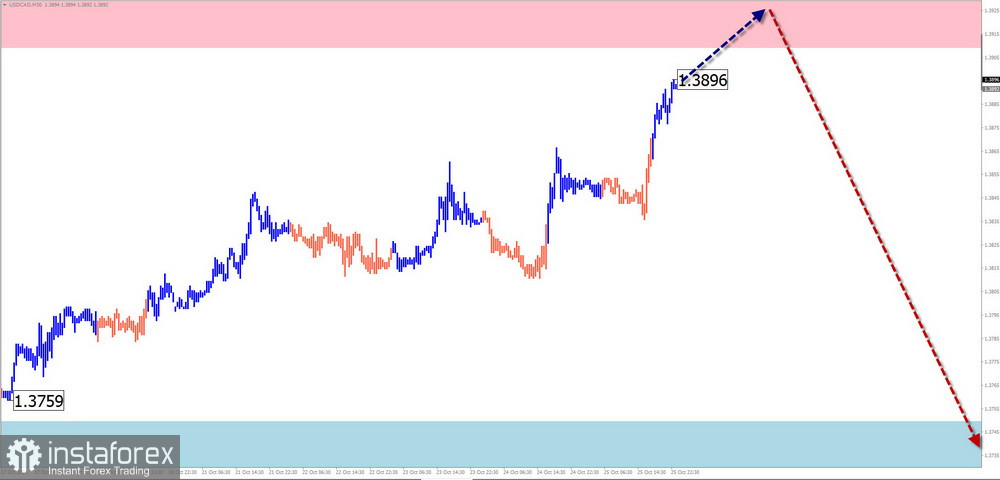
A bullish wave model has been forming for the Canadian dollar since September 25, with the first part of the structure now appearing complete. Prices are approaching the lower edge of a potential weekly reversal zone, with no reversal signals at the time of analysis.
Forecast:
A continuation of the bullish trend is expected towards the resistance zone early in the week, followed by a probable reversal and downward movement. A breakout beyond the weekly range is unlikely.
Potential Reversal Zones
Recommendations:
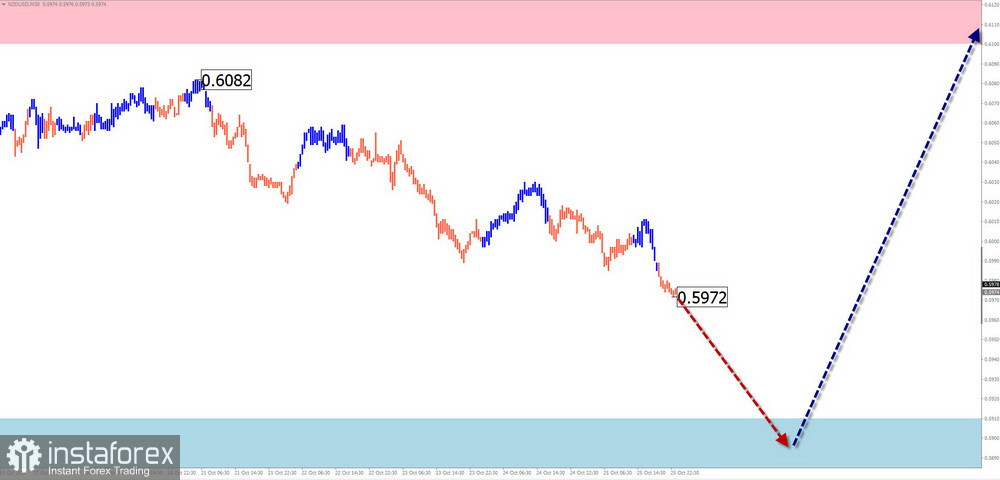
Brief Analysis:
The NZD/USD pair remains in an ongoing downward wave from September 30. Early October saw a sideways correction within this wave. The final segment (C) is yet to complete, with prices nearing strong support.
Weekly Forecast:
The pair is expected to continue its downward movement towards the support zone. Afterward, price fluctuations may transition to a sideways trend. By the weekend, increased volatility could lead to a reversal and upward movement. A brief breach of the lower support boundary is possible.
Potential Reversal Zones
Recommendations
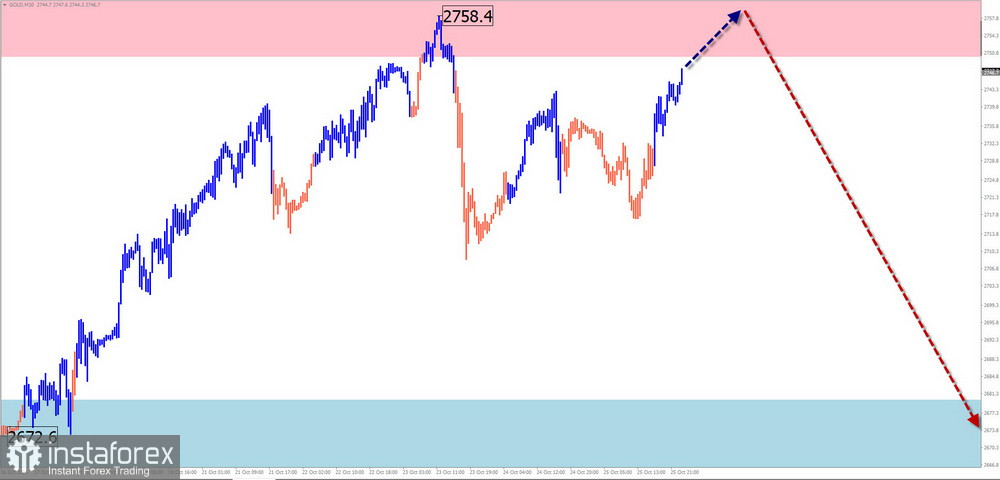
Analysis:
The dominant upward trend in gold over recent years has brought prices near a confluence of resistance zones across different scales. The trend wave structure does not appear fully complete. Over the past week, prices have moved sideways, forming the corrective phase of the last trend segment from October 8.
Forecast:
Early in the week, prices are expected to move along the calculated resistance boundaries, followed by a reversal and a transition to a sideways trend with a downward bias.
Potential Reversal Zones
Recommendations:
Explanation: In simplified wave analysis, all waves consist of three parts (A-B-C). The analysis focuses on the last, incomplete wave on each timeframe. Dashed lines indicate expected movements.
Note: The wave algorithm does not account for the duration of instrument movements over time.
Dzięki analizom InstaForex zawsze będziesz na bieżące z trendami rynkowymi! Zarejestruj się w InstaForex i uzyskaj dostęp do jeszcze większej liczby bezpłatnych usług dla zyskownego handlu.


