
 Anuluj

Formacje to modele graficzne, które są tworzone na wykresie przez cenę. Zgodnie z jednym z postulatów analizy technicznej, historia (ruch cen) powtarza się. Oznacza to, że ruchy cen są często podobne w tych samych warunkach, co pozwala z dużym prawdopodobieństwem przewidzieć dalszy rozwój sytuacji.
Formacje od InstaForex to łatwa w użyciu usługa, która pozwoli Ci być na bieżąco z najnowszymi zmianami rynkowymi i szybko reagować na pojawiające się wskazówki. W naszym serwisie zawsze znajdziesz najnowsze i najistotniejsze formacje dla każdej pary i w dowolnych ramach czasowych.
was formed on 24.03 at 01:00:40 (UTC+0)
signal strength 1 of 5
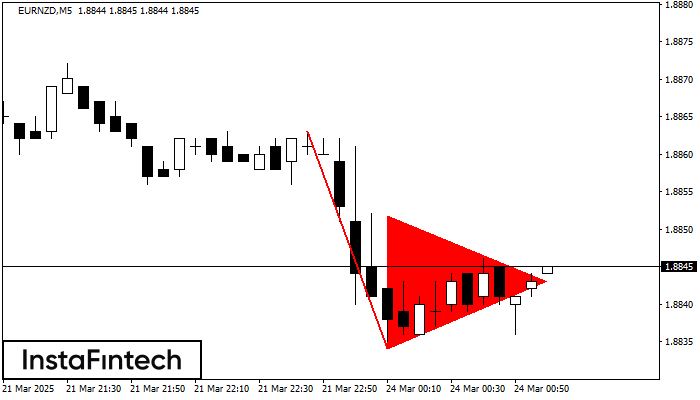
The Bearish pennant pattern has formed on the EURNZD M5 chart. It signals potential continuation of the existing trend. Specifications: the pattern’s bottom has the coordinate of 1.8834; the projection of the flagpole height is equal to 29 pips. In case the price breaks out the pattern’s bottom of 1.8834, the downtrend is expected to continue for further level 1.8819.
The M5 and M15 time frames may have more false entry points.
Zobacz także
- Wszystko
- Double Top
- Flag
- Head and Shoulders
- Pennant
- Rectangle
- Triangle
- Triple top
- Wszystko
- #AAPL
- #AMZN
- #EBAY
- #FB
- #GOOG
- #INTC
- #KO
- #MA
- #MCD
- #MSFT
- #NTDOY
- #PEP
- #TSLA
- #TWTR
- AUDCAD
- AUDCHF
- AUDJPY
- AUDUSD
- EURCAD
- EURCHF
- EURGBP
- EURJPY
- EURNZD
- EURRUB
- EURUSD
- GBPAUD
- GBPCHF
- GBPJPY
- GBPUSD
- GOLD
- NZDCAD
- NZDCHF
- NZDJPY
- NZDUSD
- SILVER
- USDCAD
- USDCHF
- USDJPY
- USDRUB
- Wszystko
- M5
- M15
- M30
- H1
- D1
- Kupno
- Sprzedaż
- Wszystko
- Wszystko
- 1
- 2
- 3
- 4
- 5
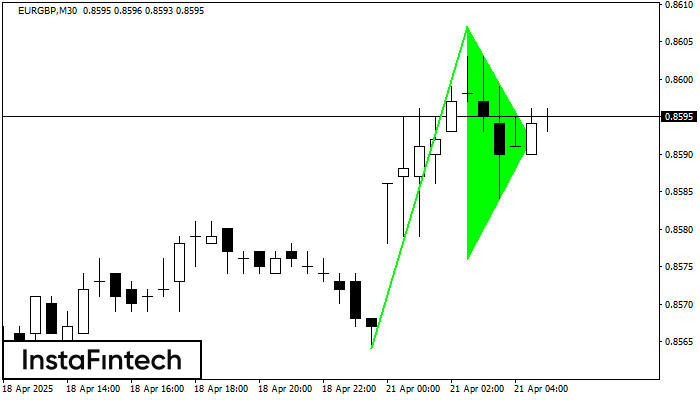
The Bullish pennant graphic pattern has formed on the EURGBP M30 instrument. This pattern type falls under the category of continuation patterns. In this case, if the quote can breaks
Open chart in a new window
The Bearish Flag pattern has been formed on the chart AUDJPY M15 which signals that the downward trend will continue. If the price breaks below the low at 90.01, then
The M5 and M15 time frames may have more false entry points.
Open chart in a new window
The Bearish pennant pattern has formed on the AUDJPY M15 chart. The pattern signals continuation of the downtrend in case the pennant’s low of 90.01 is broken through. Recommendations: Place
The M5 and M15 time frames may have more false entry points.
Open chart in a new window


