
 Anuluj


Formacje to modele graficzne, które są tworzone na wykresie przez cenę. Zgodnie z jednym z postulatów analizy technicznej, historia (ruch cen) powtarza się. Oznacza to, że ruchy cen są często podobne w tych samych warunkach, co pozwala z dużym prawdopodobieństwem przewidzieć dalszy rozwój sytuacji.
Formacje od InstaForex to łatwa w użyciu usługa, która pozwoli Ci być na bieżąco z najnowszymi zmianami rynkowymi i szybko reagować na pojawiające się wskazówki. W naszym serwisie zawsze znajdziesz najnowsze i najistotniejsze formacje dla każdej pary i w dowolnych ramach czasowych.
was formed on 25.03 at 21:36:34 (UTC+0)
signal strength 2 of 5
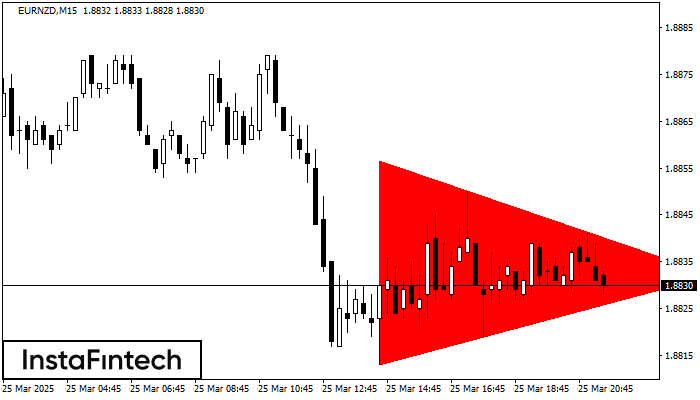
According to the chart of M15, EURNZD formed the Bearish Symmetrical Triangle pattern. Trading recommendations: A breach of the lower border 1.8813 is likely to encourage a continuation of the downward trend.
The M5 and M15 time frames may have more false entry points.
Zobacz także
- Wszystko
- Double Top
- Flag
- Head and Shoulders
- Pennant
- Rectangle
- Triangle
- Triple top
- Wszystko
- #AAPL
- #AMZN
- #EBAY
- #FB
- #GOOG
- #INTC
- #KO
- #MA
- #MCD
- #MSFT
- #NTDOY
- #PEP
- #TSLA
- #TWTR
- AUDCAD
- AUDCHF
- AUDJPY
- AUDUSD
- EURCAD
- EURCHF
- EURGBP
- EURJPY
- EURNZD
- EURRUB
- EURUSD
- GBPAUD
- GBPCHF
- GBPJPY
- GBPUSD
- GOLD
- NZDCAD
- NZDCHF
- NZDJPY
- NZDUSD
- SILVER
- USDCAD
- USDCHF
- USDJPY
- USDRUB
- Wszystko
- M5
- M15
- M30
- H1
- D1
- Kupno
- Sprzedaż
- Wszystko
- Wszystko
- 1
- 2
- 3
- 4
- 5
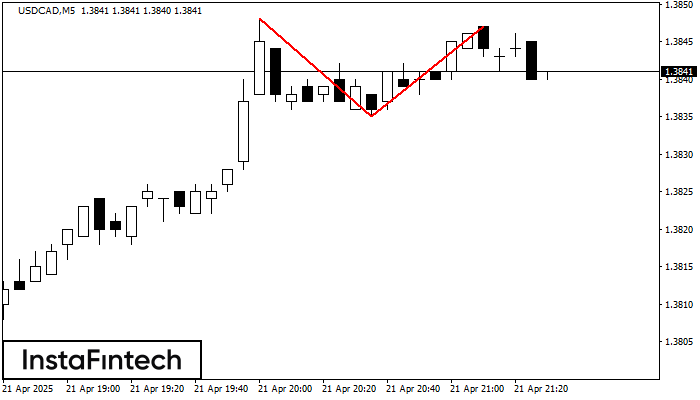
El patrón Doble Techo ha sido formado en USDCAD M5. Esto señala que la tendencia ha sido cambiada de alcista a bajista. Probablemente, si la base del patrón 1.3835
Los marcos de tiempo M5 y M15 pueden tener más puntos de entrada falsos.
Open chart in a new window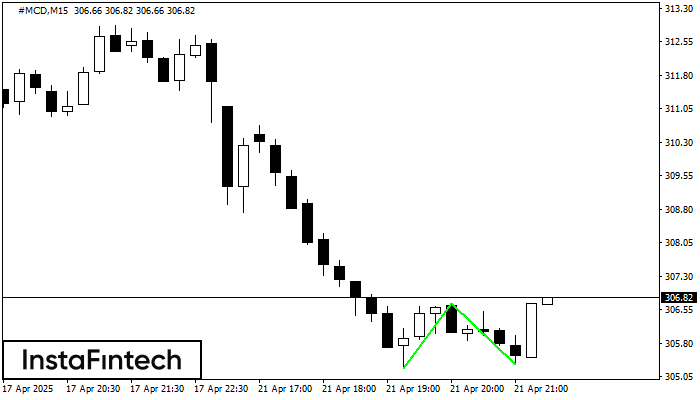
El patrón Doble Piso ha sido formado en #MCD M15. Características: el nivel de soporte 305.24; el nivel de resistencia 306.70; el ancho del patrón 146 puntos. Si el nivel
Los marcos de tiempo M5 y M15 pueden tener más puntos de entrada falsos.
Open chart in a new window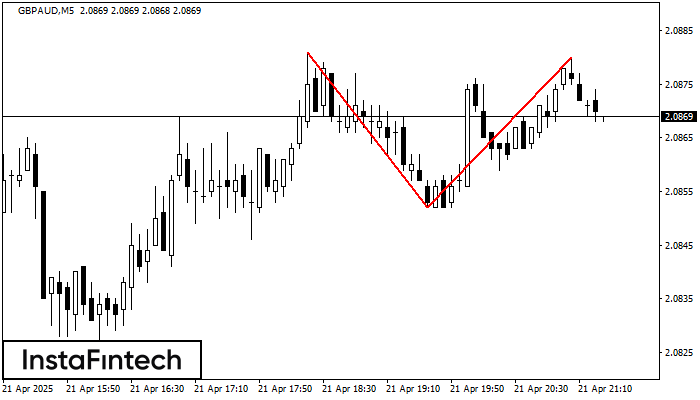
En el gráfico de GBPAUD M5 el patrón de reversión Doble Techo ha sido formado. Características: límite superior 2.0880; límite inferior 2.0852; el ancho del patrón 28 puntos. La señal
Los marcos de tiempo M5 y M15 pueden tener más puntos de entrada falsos.
Open chart in a new window


