
 Anuluj

Formacje to modele graficzne, które są tworzone na wykresie przez cenę. Zgodnie z jednym z postulatów analizy technicznej, historia (ruch cen) powtarza się. Oznacza to, że ruchy cen są często podobne w tych samych warunkach, co pozwala z dużym prawdopodobieństwem przewidzieć dalszy rozwój sytuacji.
Formacje od InstaForex to łatwa w użyciu usługa, która pozwoli Ci być na bieżąco z najnowszymi zmianami rynkowymi i szybko reagować na pojawiające się wskazówki. W naszym serwisie zawsze znajdziesz najnowsze i najistotniejsze formacje dla każdej pary i w dowolnych ramach czasowych.
was formed on 26.03 at 11:55:30 (UTC+0)
signal strength 1 of 5
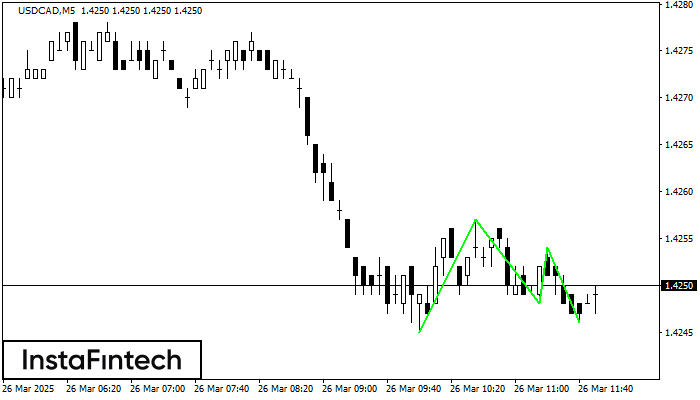
The Triple Bottom pattern has formed on the chart of USDCAD M5. Features of the pattern: The lower line of the pattern has coordinates 1.4257 with the upper limit 1.4257/1.4254, the projection of the width is 12 points. The formation of the Triple Bottom pattern most likely indicates a change in the trend from downward to upward. This means that in the event of a breakdown of the resistance level 1.4245, the price is most likely to continue the upward movement.
The M5 and M15 time frames may have more false entry points.
Zobacz także
- Wszystko
- Double Top
- Flag
- Head and Shoulders
- Pennant
- Rectangle
- Triangle
- Triple top
- Wszystko
- #AAPL
- #AMZN
- #EBAY
- #FB
- #GOOG
- #INTC
- #KO
- #MA
- #MCD
- #MSFT
- #NTDOY
- #PEP
- #TSLA
- #TWTR
- AUDCAD
- AUDCHF
- AUDJPY
- AUDUSD
- EURCAD
- EURCHF
- EURGBP
- EURJPY
- EURNZD
- EURRUB
- EURUSD
- GBPAUD
- GBPCHF
- GBPJPY
- GBPUSD
- GOLD
- NZDCAD
- NZDCHF
- NZDJPY
- NZDUSD
- SILVER
- USDCAD
- USDCHF
- USDJPY
- USDRUB
- Wszystko
- M5
- M15
- M30
- H1
- D1
- Kupno
- Sprzedaż
- Wszystko
- Wszystko
- 1
- 2
- 3
- 4
- 5

The Triple Bottom pattern has formed on the chart of AUDCHF M30. Features of the pattern: The lower line of the pattern has coordinates 0.5232 with the upper limit 0.5232/0.5218
Open chart in a new window
The Double Top reversal pattern has been formed on #Bitcoin M5. Characteristics: the upper boundary 85197.81; the lower boundary 84993.66; the width of the pattern is 23229 points. Sell trades
The M5 and M15 time frames may have more false entry points.
Open chart in a new window
According to the chart of M5, #Bitcoin formed the Bearish Rectangle which is a pattern of a trend continuation. The pattern is contained within the following borders: lower border 84213.45
The M5 and M15 time frames may have more false entry points.
Open chart in a new window


