
 Anuluj

Formacje to modele graficzne, które są tworzone na wykresie przez cenę. Zgodnie z jednym z postulatów analizy technicznej, historia (ruch cen) powtarza się. Oznacza to, że ruchy cen są często podobne w tych samych warunkach, co pozwala z dużym prawdopodobieństwem przewidzieć dalszy rozwój sytuacji.
Formacje od InstaForex to łatwa w użyciu usługa, która pozwoli Ci być na bieżąco z najnowszymi zmianami rynkowymi i szybko reagować na pojawiające się wskazówki. W naszym serwisie zawsze znajdziesz najnowsze i najistotniejsze formacje dla każdej pary i w dowolnych ramach czasowych.
was formed on 27.03 at 17:30:19 (UTC+0)
signal strength 2 of 5
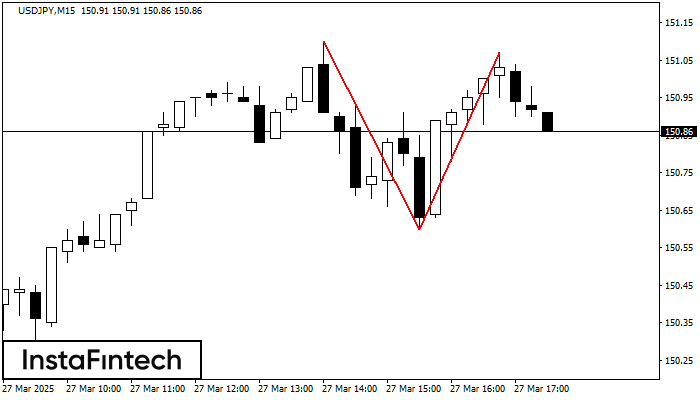
The Double Top pattern has been formed on USDJPY M15. It signals that the trend has been changed from upwards to downwards. Probably, if the base of the pattern 150.60 is broken, the downward movement will continue.
The M5 and M15 time frames may have more false entry points.
Zobacz także
- Wszystko
- Double Top
- Flag
- Head and Shoulders
- Pennant
- Rectangle
- Triangle
- Triple top
- Wszystko
- #AAPL
- #AMZN
- #EBAY
- #FB
- #GOOG
- #INTC
- #KO
- #MA
- #MCD
- #MSFT
- #NTDOY
- #PEP
- #TSLA
- #TWTR
- AUDCAD
- AUDCHF
- AUDJPY
- AUDUSD
- EURCAD
- EURCHF
- EURGBP
- EURJPY
- EURNZD
- EURRUB
- EURUSD
- GBPAUD
- GBPCHF
- GBPJPY
- GBPUSD
- GOLD
- NZDCAD
- NZDCHF
- NZDJPY
- NZDUSD
- SILVER
- USDCAD
- USDCHF
- USDJPY
- USDRUB
- Wszystko
- M5
- M15
- M30
- H1
- D1
- Kupno
- Sprzedaż
- Wszystko
- Wszystko
- 1
- 2
- 3
- 4
- 5
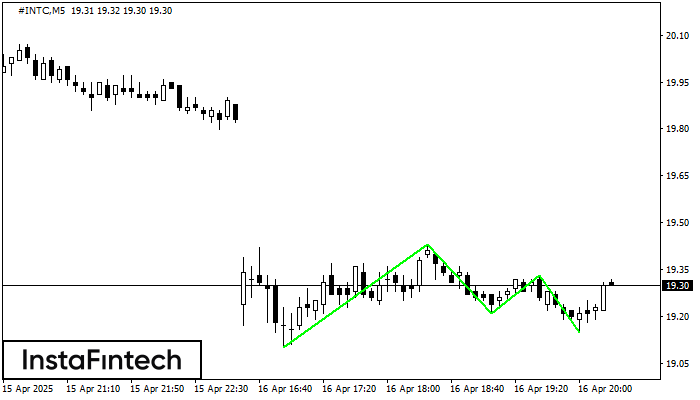
The Triple Bottom pattern has been formed on #INTC M5. It has the following characteristics: resistance level 19.43/19.33; support level 19.10/19.15; the width is 33 points. In the event
The M5 and M15 time frames may have more false entry points.
Open chart in a new window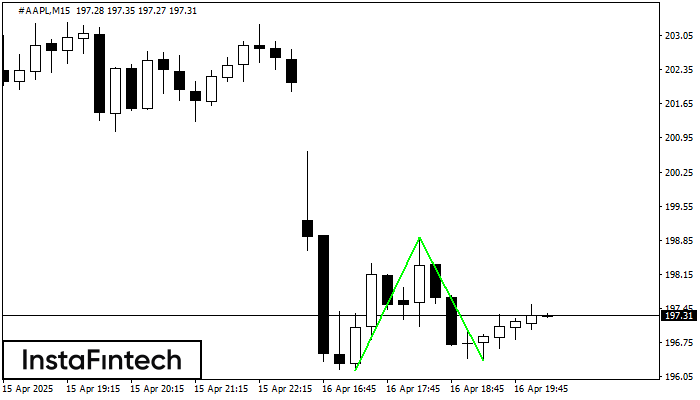
The Double Bottom pattern has been formed on #AAPL M15. This formation signals a reversal of the trend from downwards to upwards. The signal is that a buy trade should
The M5 and M15 time frames may have more false entry points.
Open chart in a new window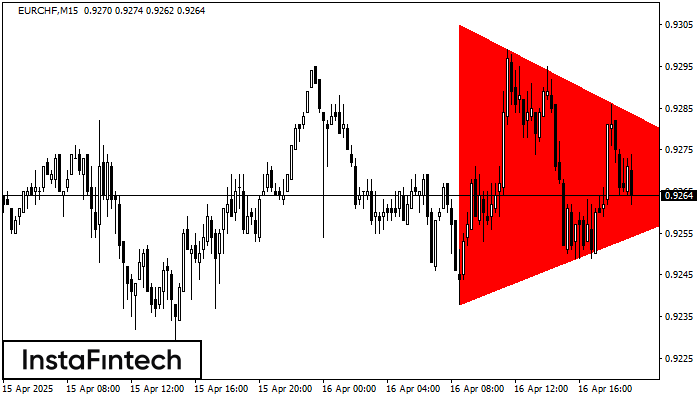
According to the chart of M15, EURCHF formed the Bearish Symmetrical Triangle pattern. This pattern signals a further downward trend in case the lower border 0.9238 is breached. Here
The M5 and M15 time frames may have more false entry points.
Open chart in a new window


