 Permanecer
Condições de Negociações
Ferramentas


The pair traded upward on Tuesday and tested the historical resistance level 1.1544 (blue dashed line). Today, the price may test this level again and roll back down. Economic calendar news for the dollar is expected at 14:00 and 14:30 UTC.
Trend analysis (Fig. 1).
The market may continue to move upward from the level of 1.1530 (closing of yesterday's daily candle) with the target at the historical resistance level of 1.1544 (blue dotted line). If this level is reached, a downward pullback is possible with the first target at 1.1492 - a 14.6% pullback level (red dotted line). When the price tests this level, the downward trend may continue with the target at 1.1458 - a 23.6% pullback level (red dotted line). An upward pullback is possible from this level.
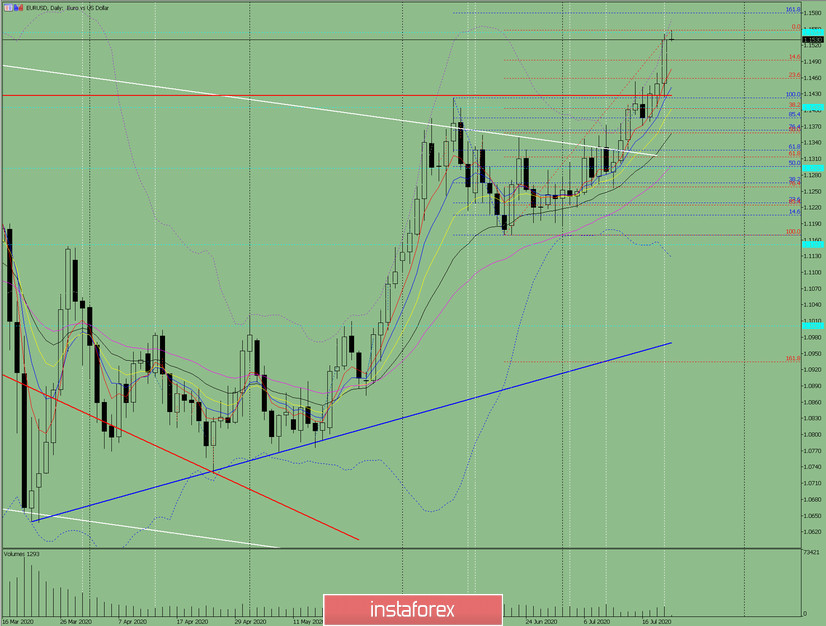
Fig. 1 (daily chart).
Comprehensive analysis:
- Indicator analysis - down;
- Fibonacci levels - down;
- Volumes - down;
- Candlestick analysis - down;
- Trend analysis - down;
- Bollinger lines - down;
- Weekly chart - down.
General conclusion:
Today the price roll back down after moving up and testing the historical resistance level of 1.1544 (blue dotted line) with the target at 1.1492 - a 14.6% pullback level (red dotted line). If this line is reached, the next target will be at 1.1458 - a 23.6% pullback level (red dotted line).
Another possible scenario is an upward trend after breaking through the historical resistance level of 1.1544 (blue dotted line) with the target at 1.1580 (blue dotted line).
InstaForex analytical reviews will make you fully aware of market trends! Being an InstaForex client, you are provided with a large number of free services for efficient trading.

