Condições de Negociações
Ferramentas

Gold edges slightly lower after testing $1,950 on Friday but manages to stay afloat in positive territory above $1,940. The impressive February jobs report from the US allowed Treasury bond yields to recover modestly, limiting XAU/USD's upside.
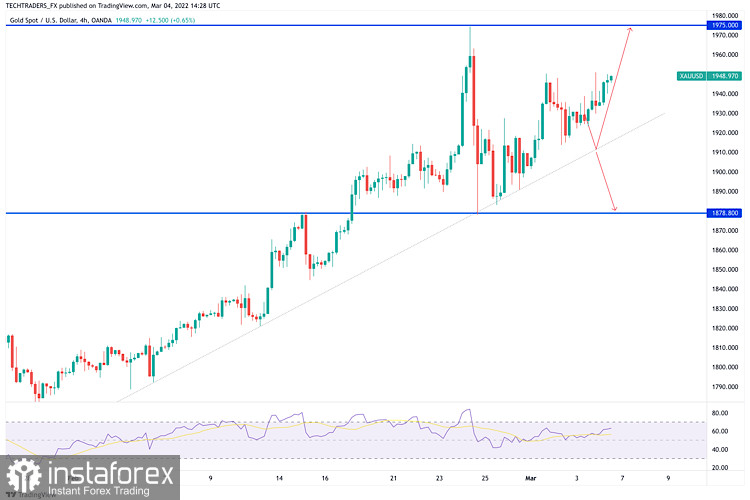
Apart from the encouraging fundamentals favoring gold price, the metal's technical setup on the four-hour chart also points to more upside. That said, the yellow metal has confirmed an upside breakout from a symmetrical triangle formation after yielding a four-hourly candlestick closing above the falling trendline resistance at $1,936.
With the bullish breakout, gold price is positioned to retest the 13-month highs of $1,975 if it finds acceptance above the $1,950 psychological barrier. The Relative Strength Index (RSI) is holding firmer above the midline, adding credence to a potential move higher.
On the downside, the immediate cushion is seen at the triangle resistance turned support at $1,935, below which a sharp sell-off could be triggered towards the powerful cap of $1,928. At that point, the triangle support and bullish 21-Simple Moving Average (SMA) coincide.
A firm break below the latter could lead to the pattern failure, fuelling a fresh downswing towards the ascending 50-SMA at $1,916.
InstaForex analytical reviews will make you fully aware of market trends! Being an InstaForex client, you are provided with a large number of free services for efficient trading.
Podemos usar cookies para analisar os dados dos nossos visitantes, melhorar nosso site e medir o desempenho da publicidade. No geral, esses dados são usados para proporcionar uma melhor experiência no site. Mais informações.
Your IP address shows that you are currently located in the USA. If you are a resident of the United States, you are prohibited from using the services of Instant Trading EU Ltd including online trading, online transfers, deposit/withdrawal of funds, etc.
If you think you are seeing this message by mistake and your location is not the US, kindly proceed to the website. Otherwise, you must leave the website in order to comply with government restrictions.
Why does your IP address show your location as the USA?
Please confirm whether you are a US resident or not by clicking the relevant button below. If you choose the wrong option, being a US resident, you will not be able to open an account with InstaForex anyway.
We are sorry for any inconvenience caused by this message.
 Permanecer


