 Permanecer
Condições de Negociações
Ferramentas


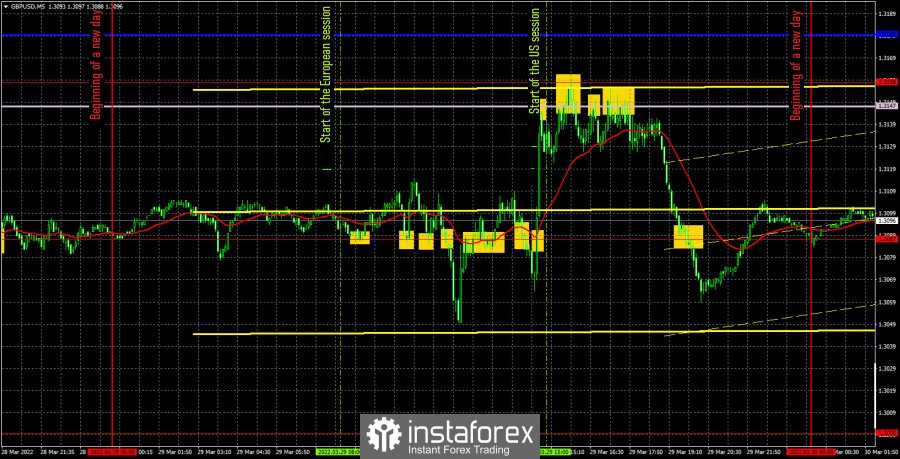
The GBP/USD currency pair also moved very volatile on Tuesday. The pair rode on a "swing" in the morning, but then the results of the negotiations in Turkey were announced, so the pound rose sharply in price. However, the bulls did not have to rejoice for a long time, as strong short positions on the British currency began near the important level of 1.3158, which led to a strong drop in the pair. As a result, the pound ended the day even lower than it started it. It failed to extract any profit from such a strong event. And its further prospects are still negative.
There were a lot of trading signals today and most of them formed near the extreme level of 1.3087. In the first half of the day, if not a flat, then a very similar movement was observed. The first three buy signals, in fact, duplicated each other, and as a result, the only long position closed at breakeven on Stop Loss, since the pair still went up the necessary 20 points. This was followed by a sell signal, but the short position on it also closed at breakeven on Stop Loss. All subsequent signals near the 1.3087 level should have been ignored. Thus, the next deal was a short position after four bounces from the Senkou Span B line. It was she who brought the greatest profit, since the price eventually began a strong fall, which ended only around 1.3070. It was there that the short position should have been closed manually, and the profit was at least 50 points. In general, a very good day, in terms of trading and profit.
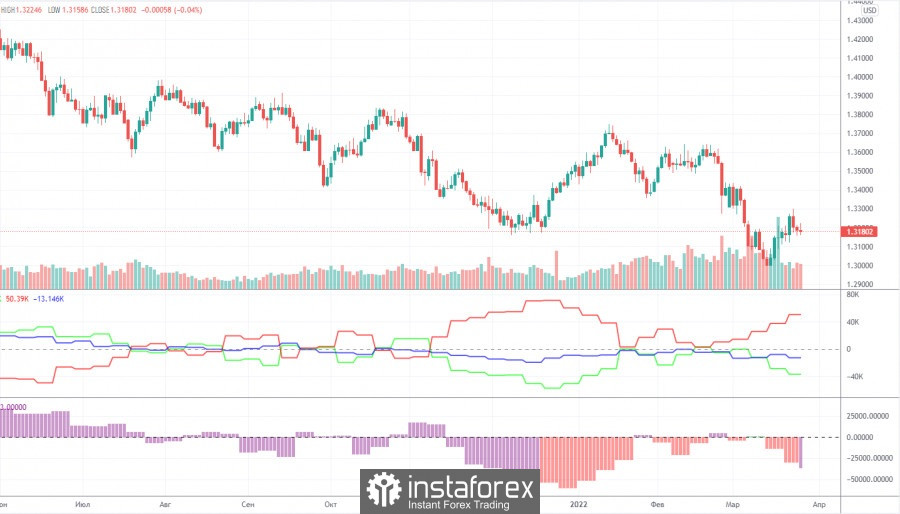
The latest Commitment of Traders (COT) report on the British pound showed a new strengthening of the bearish mood among professional traders. However, in general, the mood of the major players has changed too often in recent months, which is clearly seen by the two indicators in the chart above: they are constantly changing the direction of their movement. At the moment, the number of open long positions is less than the number of short positions by almost 37,000. Although three weeks ago their number was almost the same. Thus, the non-commercial group has dramatically changed its mindset, but at the same time it is still not possible to draw any medium-term conclusions now. Firstly, as already mentioned, the mood of major players changes too often, so it is impossible to identify any trend. Secondly, at this time, not only the demand for the pound, which is displayed in the COT reports, matters, but also the demand for the dollar. Thirdly, the geopolitical factor can have an unexpected and sudden impact on the movement of the pound/dollar pair. Therefore, at this time, we can assume a new medium-term fall of the British pound without COT reports. The pound may even rise by 200-300 points at first as part of the next round of correction, and only after that it will rush down again. Non-commercial traders reduced their net position by 8,000 contracts during the reporting week.
Overview of the EUR/USD pair. March 30. The euro and the pound shot up on expectations of an agreement between Ukraine and Russia.
Overview of the GBP/USD pair. March 30. Speech by Andrew Bailey... Who is interested in it now? Negotiations between Kiev and Moscow!
Forecast and trading signals for EUR/USD on March 30. Detailed analysis of the movement of the pair and trading transactions.
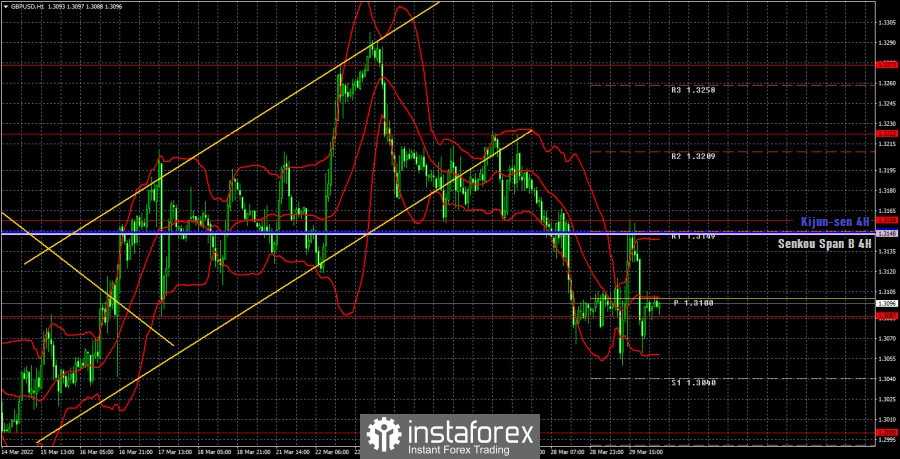
On the hourly timeframe, you can clearly see how the pair moved during Tuesday. First, a strong upward movement, therefore, no less a strong fall. It was not possible to settle above the Senkou Span B and Kijun-sen lines, so the downward trend continues. That is why the pound may continue to fall in the medium term. The fundamental and geopolitical background for him has not changed much over the past day. We highlight the following important levels on March 30: 1.3000, 1.3087, 1.3158, 1.3222, 1.3273. The Senkou Span B (1.3148) and Kijun-sen(1.3148) lines can also be signal sources. Signals can be "bounces" and "breakthroughs" of these levels and lines. It is recommended to set the Stop Loss level to breakeven when the price passes in the right direction by 20 points. The lines of the Ichimoku indicator can move during the day, which should be taken into account when determining trading signals. There are also support and resistance levels on the chart that can be used to take profits on transactions. There are no important events scheduled for Wednesday in the UK, and there are two important reports in the US: on GDP and from ADP. However, we believe that the market will look forward to the results of the next round of negotiations between Ukraine and Russia with great impatience. It will take place today.
Support and Resistance Levels are the levels that serve as targets when buying or selling the pair. You can place Take Profit near these levels.
Kijun-sen and Senkou Span B lines are lines of the Ichimoku indicator transferred to the hourly timeframe from the 4-hour one.
Support and resistance areas are areas from which the price has repeatedly rebounded off.
Yellow lines are trend lines, trend channels and any other technical patterns.
Indicator 1 on the COT charts is the size of the net position of each category of traders.
Indicator 2 on the COT charts is the size of the net position for the non-commercial group.
InstaForex analytical reviews will make you fully aware of market trends! Being an InstaForex client, you are provided with a large number of free services for efficient trading.

