 Permanecer
Condições de Negociações
Ferramentas


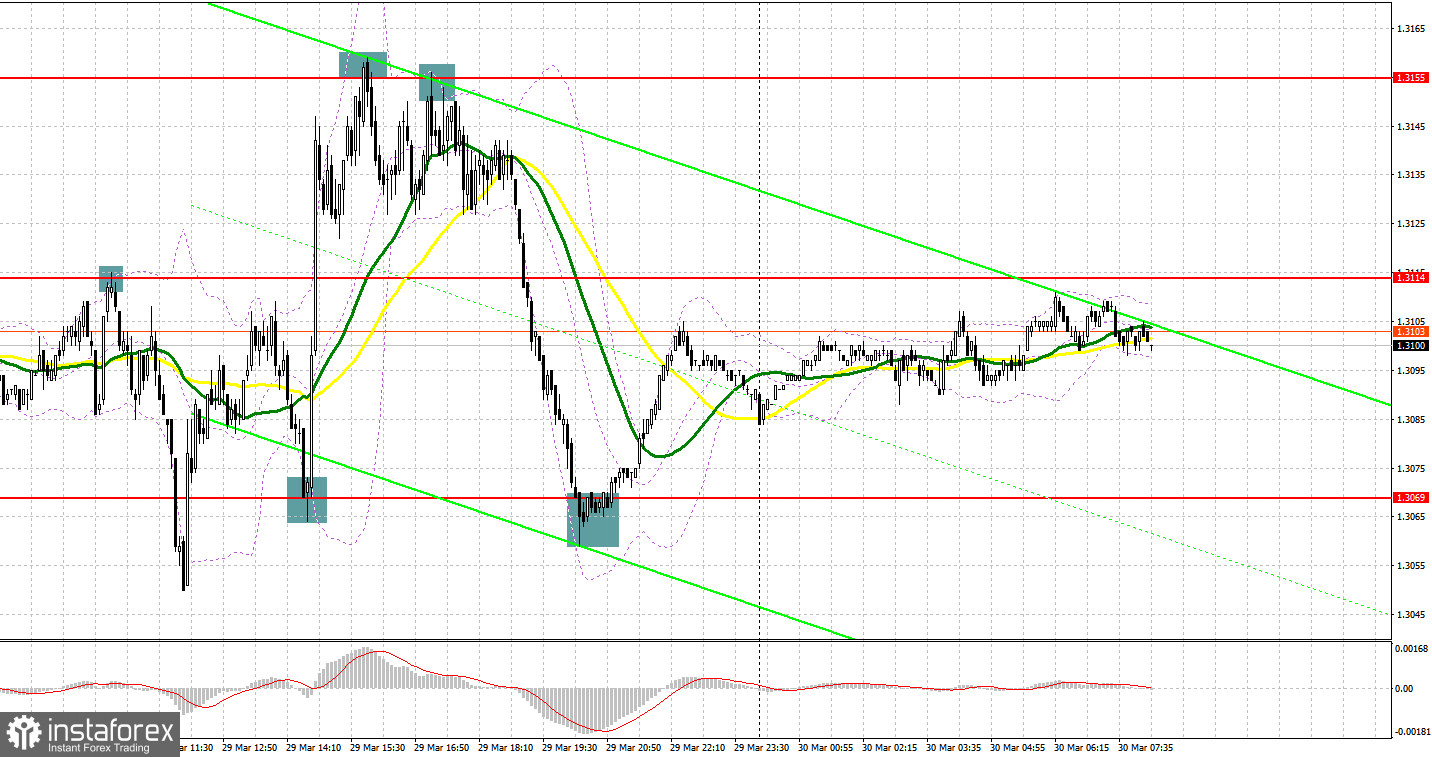
Yesterday, many profitable trading signals were made. Let's look at the 5-minute chart and try to figure out what actually happened. Given the bearish trend on GBP/USD, a false breakout was all sellers needed in the first half of the day. This is exactly what happened and led to a mass sell-off of the pound by more than 60 pips. Due to the MACD divergence, long positions could have been opened when a false breakout occurred at 1.3070 after the price had reached the new weekly high. Eventually, the price returned above 1.3070, and a buy signal was made. However, if you missed that signal, you could have entered long positions from 1.3069 after a false breakout of this mark in the second half of the day. As a result, the pound skyrocketed by over 90 pips to 1.3160. During the North American session, a sell signal was produced when bears tried to protect the 1.3155 level at which a false breakout occurred. Overall, the price fell by about 80 pips.
When to go long on GBP/USD:
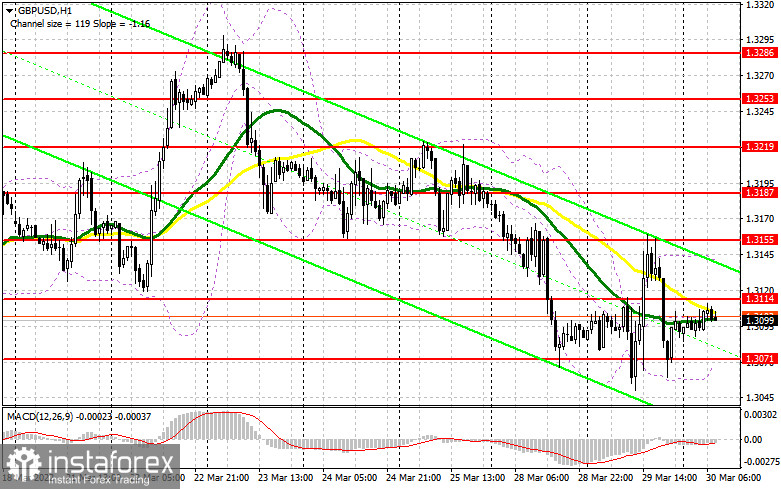
No macro events are expected to unfold in the United Kingdom today. Therefore, bulls will try to return to the upper limit of the sideways channel. It will become possible if they break above 1.3114. A statement by Ben Broadbent, Deputy Governor for Monetary Policy at the Bank of England, is unlikely to provide support for the pound, given the regulator's current stance on monetary policy. The dovish rhetoric of Governor Andrew Bailey has had a harmful effect on the sterling. In this light, traders are now reluctant to invest in the British currency. A buy signal will be made just in case of a false breakout at 1.3071, allowing GBP/USD to return to resistance at 1.3114, in line with bearish moving averages. If traders find nothing alarming in the statement of the BoE representative, we may see a breakout at 1.3114. A test of the mark top-bottom will produce an additional entry point, an bull will push the price to the 1.3155 high. Yesterday, buyers tried to break above the barrier, though in vain. Demand for risk assets is stable in the face of substantial progress made by Russia and Ukraine during peace talks. In this light, bulls will try to push the pair to new resistance at 1.3187. A more distant target is seen at 1.3219, where you should consider taking a profit. Yet, approaching this target could be challenging enough. In the event of bearish GBP/USD during the European session and a decrease in bullish activity at 1.3071, you could go short only when the price reaches the low at 1.3037 or support at 1.3003. A false breakout of these levels will allow the bearish trend to continue, creating a market entry point when the price rebounds briefly. Long positions on GBP/USD could also be entered on a bounce off 1.2960, allowing a 30-35 pips correction intraday.
When to go short on GBP/USD:
Yesterday's fall in the pound during the North American session indicates that bulls are under pressure. Therefore, strong bearish bias is likely to continue today. The pair is traded below the moving averages, reflecting a bearish market. Sellers will try to protect the 1.3114 mark today. In the case of a false breakout there, a sell entry point will be made, with the target at 1.3071. Bulls and bears will both try to establish control over this level because if the price leaves the range again, it will trigger a row of stop orders, and GBP/USD will plunge to the 1.3037 and 1.3003 lows. A more distant target is seen at 1.2960, where you should consider taking a profit. In the event of bullish GBP/USD during the European session and a decrease in bearish activity at 1.3114, you could go short when the price reaches the 1.3155 level, and if there is a false breakout there. Short positions on GBP/USD could be entered on a bounce from the 1.3187 high or even higher, from 1.3219, allowing a 30-35 pips correction intraday.
Commitments of Traders:
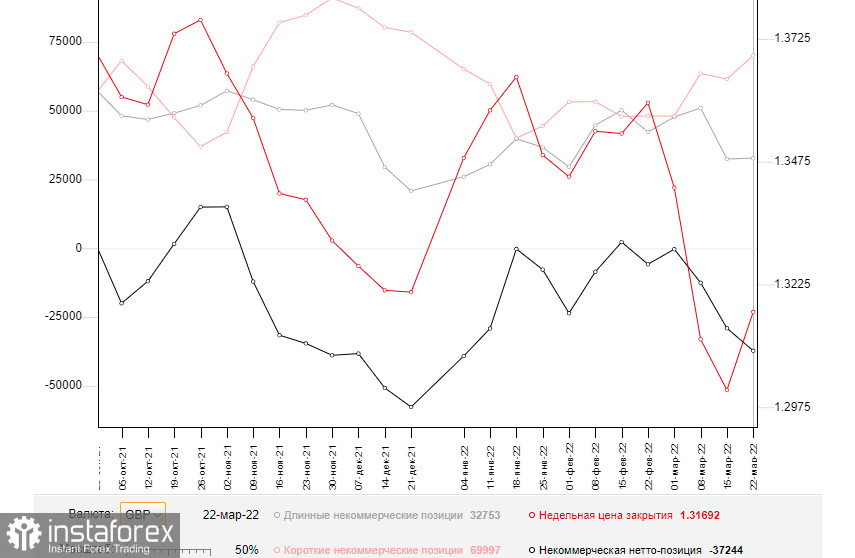
The COT report from March 22 logged a sharp increase in short positions and a minor rise in long ones. The pound again came under pressure after statements made by Fed policymakers last week. The sterling is still unable to recover due to certain headwinds in the UK economy that put a strain on households. Experts warn that inflationary risks hinder a normal pace of economic development in the country. So, the situation may get even worse. Soaring energy prices, the geopolitical tensions in Ukraine, the backlash of severe Western sanctions are harmful to the British economy. The dovish stance of the Bank of England's Governor has made traders sell the sterling this week. The sell-off is likely to continue due to the lack of positive news. The only positive factor GBP bulls can rely on is progress in Russia-Ukraine peace talks. According to the COT report from March 22, long non-commercial positions increased to 32,753 from 32,442. Short non-commercial positions climbed to 69,997 from 61,503. As a result, the negative value of non-commercial net positions grew to -37,244 from -29.061. The weekly closing price increased to 1.3169 versus 1.3010.
Indicator signals:
Moving averages
Trading is carried out below the 30-day and 50-day moving averages, indicating that bulls are attempting to gain control over the market.
Note: The period and prices of moving averages are viewed by the author on the hourly chart and differ from the general definition of classic daily moving averages on the daily chart.
Bollinger Bands
The lower band at 1.3071 stands as support. Resistance is seen at 1.3145 in line with the upper band.
Indicator description:
InstaForex analytical reviews will make you fully aware of market trends! Being an InstaForex client, you are provided with a large number of free services for efficient trading.

