 Permanecer
Condições de Negociações
Ferramentas


The EUR/USD pair showed a good movement on Tuesday, but, unfortunately, only in the afternoon. There was a slight downward slope in the morning, but the whole movement was more like a flat. With macroeconomics, everything was quite difficult on Tuesday. The European index of business activity in the service sector turned out to be higher than forecasts and higher than the previous value, but the euro currency fell after its release. The ISM services business activity index in the United States turned out to be better than the previous month, but worse than forecasts, and after it the same trend movement began, after which the dollar strengthened by 50 points. From our point of view, the ISM index was not so strong as to provoke a rise in the dollar. Recall that last Friday traders simply ignored much more important reports. The European Union announced new sanctions against Russia, which will prohibit the presence of Russian ships in European ports, prohibit the import of coal from Russia and prohibit several other banks of Russia from using the SWIFT system. From our point of view, it was the new sanctions that provoked the fall of the euro currency. However, it should be recognized that the ISM index could also play a role.
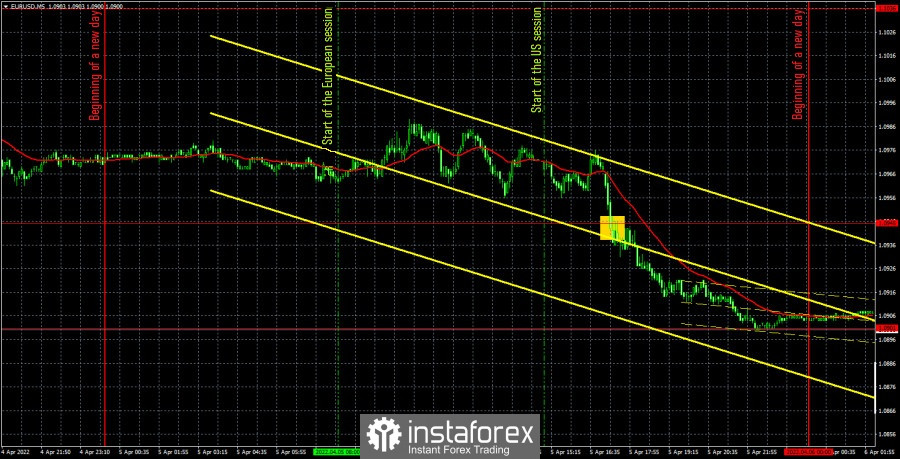
Only one trading signal was generated during the past day. The price overcame the level of 1.0945, after which it was able to go down about 20 more points. That's how much traders could earn yesterday, having worked out this signal with a short position, which should have been closed manually.
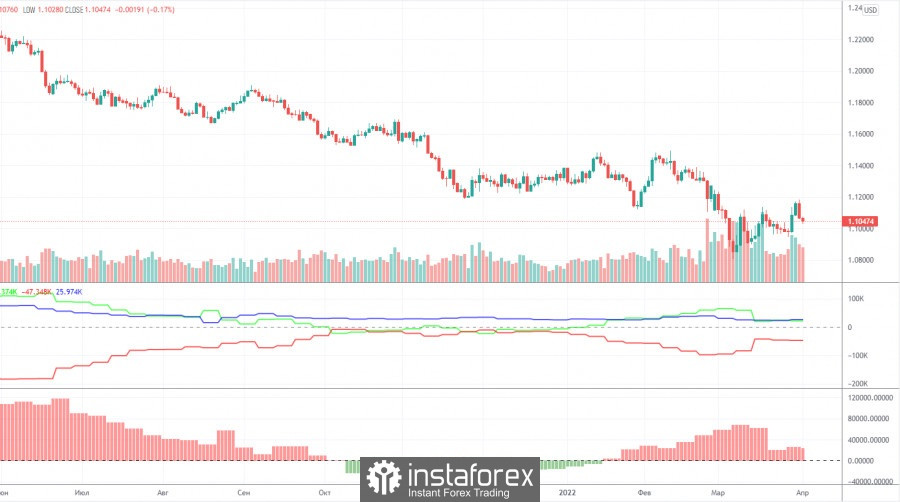
The latest, Commitment of Traders (COT) report turned out to be as neutral as possible and did not show any serious changes in the mood of professional traders. The non-commercial group closed about 7,000 contracts long positions and 4,500 short positions during the reporting week. The net position of this group decreased by 2,500. At the same time, the total number of long positions still exceeds the total number of short positions of major players. That is, their mood is still bullish, although the euro has been falling for 14-15 months. Earlier, we have already drawn attention to the fact that in January and February, major players increased longs on the euro currency. In theory, this should have led to the growth of the currency itself. However, the euro did not show anything other than the usual slight correction. Since it was in January-February, when the geopolitical situation in the world and in Europe began to deteriorate sharply, we assume that at that time the demand for the US dollar was growing very much. That is why there was an increase in the euro/dollar pair, despite the fact that the demand for euros among market participants was also growing. The demand for the dollar just grew faster and stronger. Now the factor of geopolitics remains in force, therefore, with the bullish mood of the major players, it is quite possible to expect a new fall in the European currency. To some extent, this is a paradox, but a paradox explained by the current circumstances that have developed in the world.
Overview of the EUR/USD pair. April 6. New sanctions against Russia may be introduced today. The euro continues to fall.
Overview of the GBP/USD pair. April 6. The pound suffers from the geopolitical position of Boris Johnson.
Forecast and trading signals for GBP/USD on April 6. Detailed analysis of the movement of the pair and trading transactions.
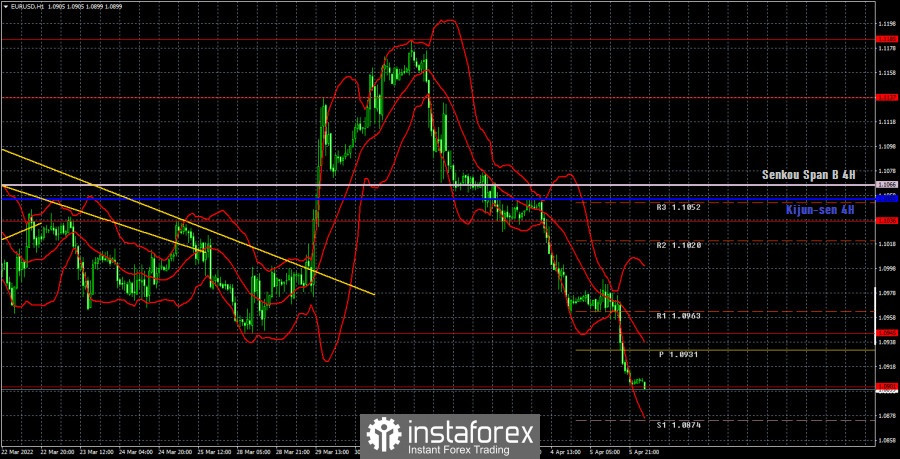
It is clearly visible on the hourly timeframe that a new round of downward movement is continuing, but now even a trend line cannot be formed along this turn, since the fall is almost non-stop. If we form a trend line now, then the first correction will lead to the price settling above it. And that doesn't make any sense. Thus, the euro remains an extremely weak currency due to geopolitics and macroeconomics and is likely to continue its decline. We allocate the following levels for trading on Wednesday – 1.0806, 1.0901, 1.0945, 1.1036, as well as the Senkou Span B (1.1066) and Kijun-sen (1.1055) lines. The lines of the Ichimoku indicator can move during the day, which should be taken into account when determining trading signals. There are also support and resistance levels, but no signals will be formed near them. Signals can be "bounces" and "breakthrough" levels - extremes and lines. Do not forget about placing a Stop Loss order at breakeven if the price went in the right direction of 15 points. This will protect you against possible losses if the signal turns out to be false. There are no important events scheduled for April 6 in the European Union. We only have the minutes of the Federal Reserve's March meeting in the United States, which is when the key rate could be raised for the first time. It could potentially be interesting. In particular, it will be possible to find out how many FOMC members support a 0.5% rate increase at the next meetings or similar information. However, it will be published late in the evening, when it is no longer recommended to open transactions.
Support and Resistance Levels are the levels that serve as targets when buying or selling the pair. You can place Take Profit near these levels.
Kijun-sen and Senkou Span B lines are lines of the Ichimoku indicator transferred to the hourly timeframe from the 4-hour one.
Support and resistance areas are areas from which the price has repeatedly rebounded off.
Yellow lines are trend lines, trend channels and any other technical patterns.
Indicator 1 on the COT charts is the size of the net position of each category of traders.
InstaForex analytical reviews will make you fully aware of market trends! Being an InstaForex client, you are provided with a large number of free services for efficient trading.

