 Permanecer
Condições de Negociações
Ferramentas


Details of the economic calendar for September 5
Data on indices of business activity in the services sector in Europe and the UK were published, which came out worse than expected.
Details of statistical indicators:
Eurozone services PMI fell from 51.2 to 49.8 points against the expectation of 50.2 points. The composite index fell from 49.9 to 48.2 points.
The euro was already heavily oversold at the time of the release of the data, so it was difficult to fall further.
UK services PMI fell from 52.6 to 50.9 points, with forecast of a decline to 52.5 points. The composite index fell from 52.1 to 49.6 points.
The pound sterling, like the euro, was oversold; there was no reaction to the statistics.
Data on retail sales in the euro area were also published: its rate of decline slowed down from -3.2% to -0.9% YoY. Despite the fact that the data came out worse than expected (-0.7%), the euro ignored them.
The reason for the lack of response to statistical indicators arose due to the commodity market.
Yesterday, with the opening of trading, there was a sharp increase in the cost of gas in Europe, which jumped by 30% to $2,800 per thousand cubic meters.
The reason for the increase in the cost of gas lies in the message of Gazprom on Friday evening that the maintenance of the only working turbine of SP-1 revealed "gross violations" and the gas pipeline will not work without their elimination.
Speculators worked out this information flow in the form of a sell-off of the euro, where, through a positive correlation, it followed the euro and the pound sterling.
As soon as the price of gas began to recover relative to the morning jump, the euro began to strengthen, followed by the pound.
Analysis of trading charts from September 5
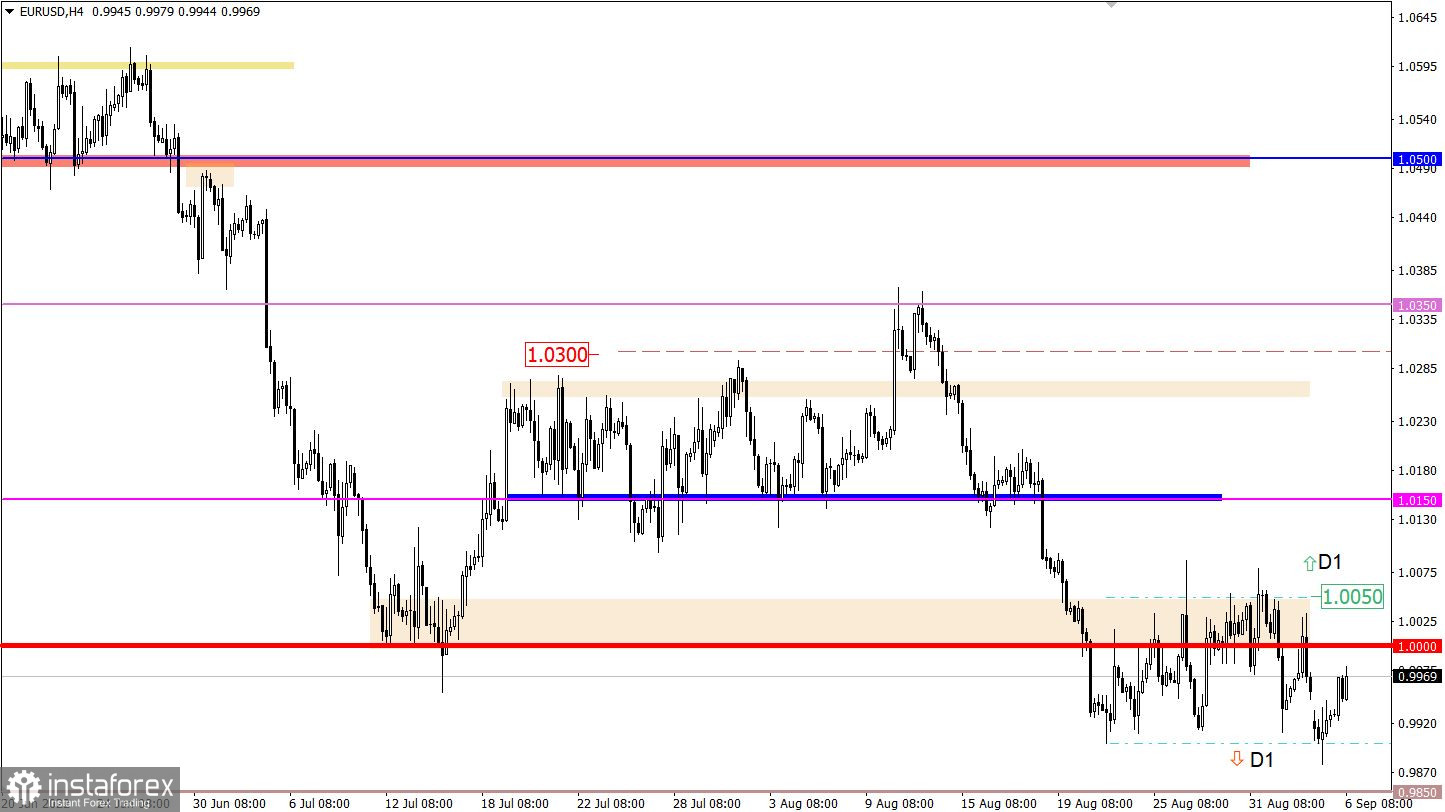
The EURUSD currency pair opened a new trading week with an intensive decline, during which the quote temporarily fell below 0.9900. The speculators failed to stay outside the control value, which resulted in a technical pullback.
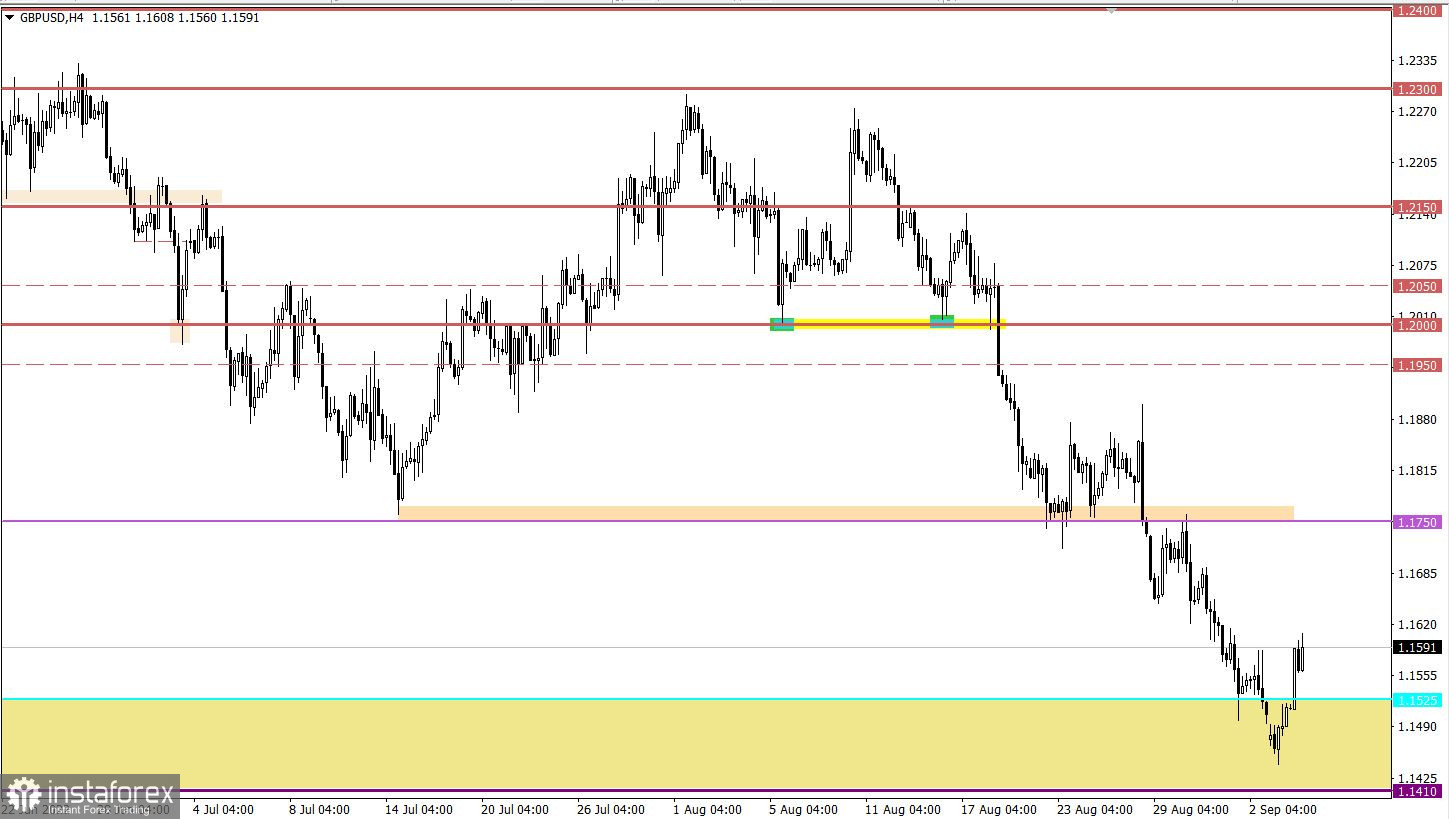
The GBPUSD currency pair, through a positive correlation with EURUSD, first rushed down, almost reaching the 2020 low, and then moved into the pullback stage.
Economic calendar for September 6
The United States is coming off a three-day holiday today, and service sector PMI data will be released.
In the UK, data on the index of business activity in the construction sector will be released, where they predict its decline. Not the best signal for the pound sterling, but it is worth considering that it is already oversold in the market.
Time targeting:
UK Construction PMI (Aug) – 08:30 UTC
US Services PMI (Aug) – 13:45 UTC
Trading plan for EUR/USD on September 6
Despite the speculative activity, the quote is still within the range of 0.9900/1.0050. Thus, traders are guided by the borders of the flat, working according to the method of breakdown or rebound from the given values.
Trading plan for GBP/USD on September 6
With the pound losing more than 800 pips in value in three weeks, a pullback/correction was brewing in the market due to short overheating. In this situation, holding the price above 1.1620 will lead to the subsequent strengthening of the pound towards 1.1750.
As for the prolongation of the downward trend, it is necessary to keep the price below the value of 1.1400 in the daily period.
What is shown in the trading charts?
A candlestick chart view is graphical rectangles of white and black light, with sticks on top and bottom. When analyzing each candle in detail, you will see its characteristics of a relative period: the opening price, closing price, and maximum and minimum prices.
Horizontal levels are price coordinates, relative to which a stop or a price reversal may occur. These levels are called support and resistance in the market.
Circles and rectangles are highlighted examples where the price of the story unfolded. This color selection indicates horizontal lines that may put pressure on the quote in the future.
The up/down arrows are the reference points of the possible price direction in the future.
InstaForex analytical reviews will make you fully aware of market trends! Being an InstaForex client, you are provided with a large number of free services for efficient trading.


