 Permanecer
Condições de Negociações
Ferramentas


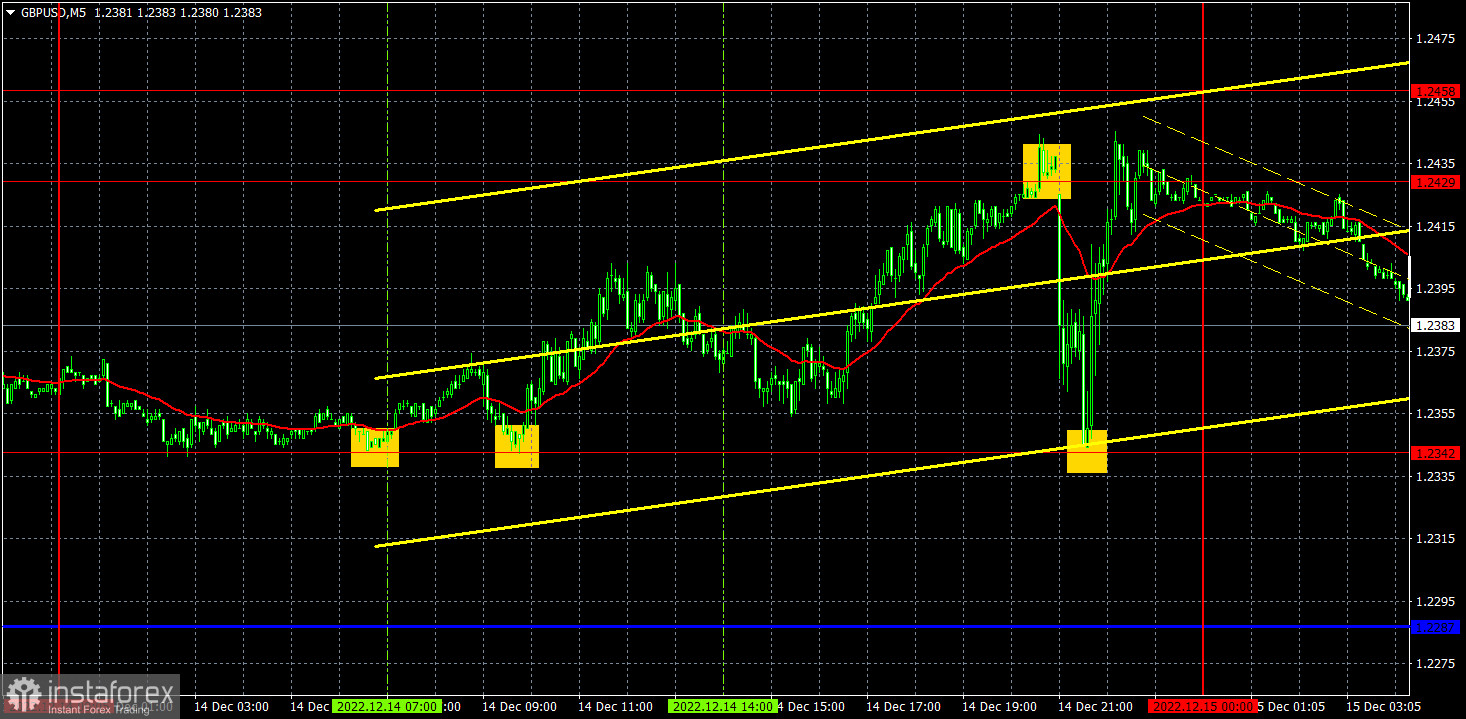
On Wednesday, GBP/USD traded in the range of 1.2342-1.2429. The pair edged higher even before the FOMC meeting and continues going north still. In fact, GBP/USD has been on the rise lately for no reason. The Fed's interest rate decision came in line with expectations. Meanwhile, the UK's macro data this week was simply ignored by traders. Nevertheless, the US dollar tumbled against the pound again. In the course of the Asian session, the quote edged down, which is merely a technical correction.
Speaking of trading signals, there were enough of them on Wednesday. Two signals were formed at around 1.2342. The price failed to rise by 20 pips after the first signal, so a buy trade shouldn't have been closed. Consequently, the pair grew to the target level of 1.2429 before the announcement of the Fed's decision. So, traders were able to close long positions with a profit of about 60 pips. Signals that came by the end of the day should not have been priced.
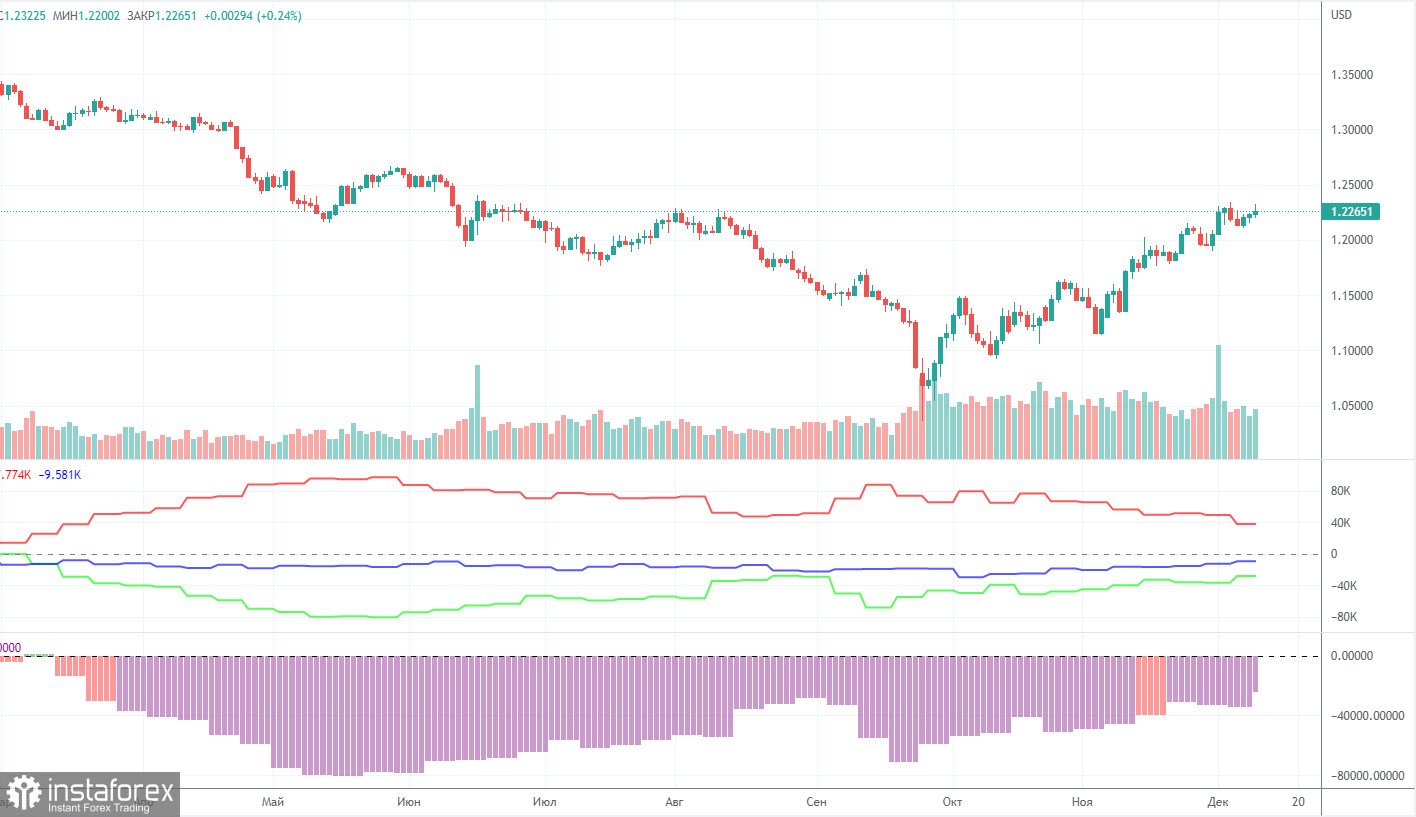
The latest COT report showed a decrease in bearish sentiment. In a week, non-commercial traders opened 1,700 long positions and closed 7,800 short positions. The net position grew by about 10,000. This figure has been on the rise for several months. Nevertheless, the sentiment of non-commercial traders remains bearish, and GBP/USD is on the rise for no reason. We assume that the pair may well resume the downtrend soon. Notably, both GBP/USD and EUR/USD now show practically identical movement. However, the net position on EUR/USD is positive and negative on GBP/USD. Non-commercial traders now hold 54,000 short positions and 30,000 long ones. The gap between them is still wide. As for the total number of open longs and shorts, the bulls have an advantage here by 10,000. Technical factors indicate that GBP/USD may move in an uptrend in the long term. At the same time, fundamental and geopolitical factors signal that the pair is unlikely to strengthen significantly.
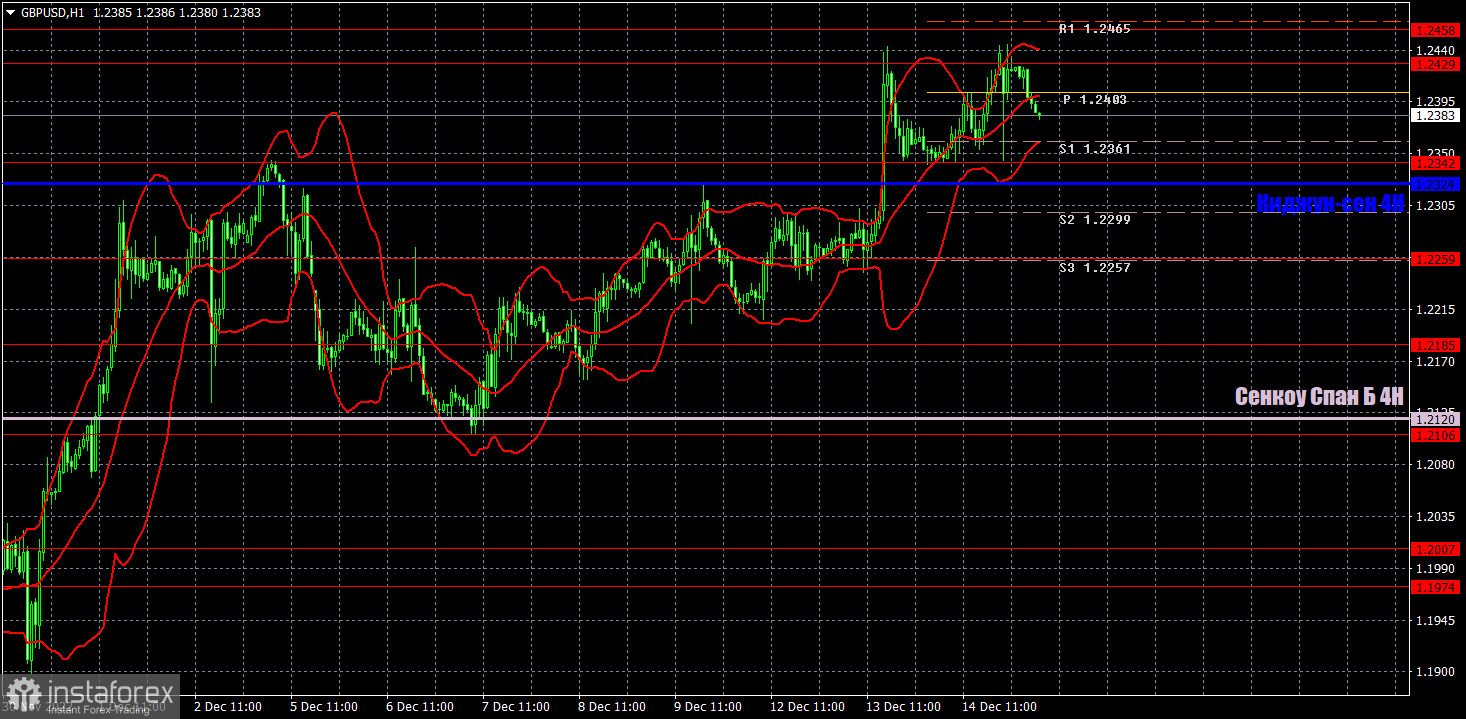
In the H1 time frame, GBP/USD keeps trading higher post-FOMC meeting, which isn't surprising as the outcome as well as Powell's speech could hardly be called hawkish. So, the uptrend goes on. We still believe that a strong bearish correction is needed. It may occur if there are strong sell signals only. The price should break through the Ichimoku lines at least. On December 15th, trading levels are seen at 1.2106, 1.2185, 1.2259, 1.2342, 1.2429-1.2458, 1.2589, 1.2659, 1.2121 (Senkou Span B), and 1.2324 (Kijun-sen). Signals are made whenever the price bounces or breaks through these levels and lines. Don't forget to place a stop-loss order at the breakeven point when the price passes 20 pips in the right direction. Ichimoku indicator lines can move during the day, which should be taken into account when determining trading signals. There are also support and resistance although no signals are made near these levels, which can be used for profit-taking. On Thursday, the Bank of England will announce its interest rate decision and the US will deliver several macro reports. We expect high volatility today as well as anticipate that the BoE with Andrew Bailey will surprise traders.
Resistance/support - thick red lines, near which the trend may stop. They do not make trading signals.
The Kijun-sen and Senkou Span B lines are the Ichimoku indicator lines moved to the hourly timeframe from the 4-hour timeframe. They are also strong lines.
Extreme levels are thin red lines, from which the price used to bounce earlier. They can produce trading signals.
Yellow lines are trend lines, trend channels, and any other technical patterns.
Indicator 1 on the COT chart is the size of the net position of each trader category.
Indicator 2 on the COT chart is the size of the net position for the Non-commercial group of traders.
InstaForex analytical reviews will make you fully aware of market trends! Being an InstaForex client, you are provided with a large number of free services for efficient trading.


