 Permanecer
Condições de Negociações
Ferramentas


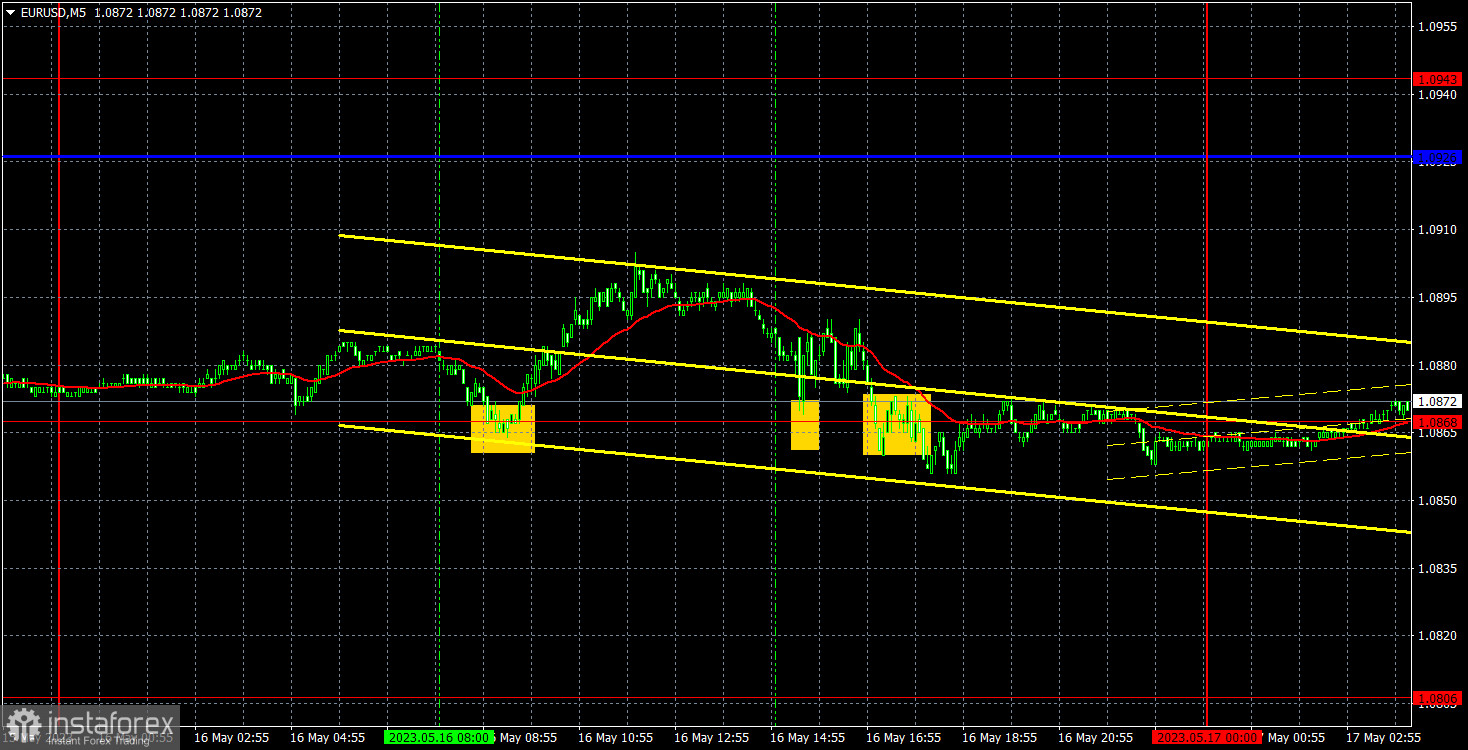
EUR/USD volatility on Tuesday totaled 50 pips. Meanwhile, it was rather sluggish on Monday. Moreover, there were macro releases in the United States and the eurozone yesterday. The second estimate for GDP in the eurozone came in line with the first estimate. At the same time, reports in the US unexpectedly missed forecasts. When these reports were published, volatility was just 10-20 pips.
Three trading signals, all near 1.0868, came on Tuesday. When the first signal was generated, traders could open long positions, but the pair advanced by just 23 pips, which was enough to set a Stop Loss at the breakeven point. The second buy signal was even weaker than the first one, and the pair failed to rise by 15 pips. The third signal was ignored because the first two signals were false. All in all, traders could post small losses at the close of the trading day due to a flat trend and low volatility.
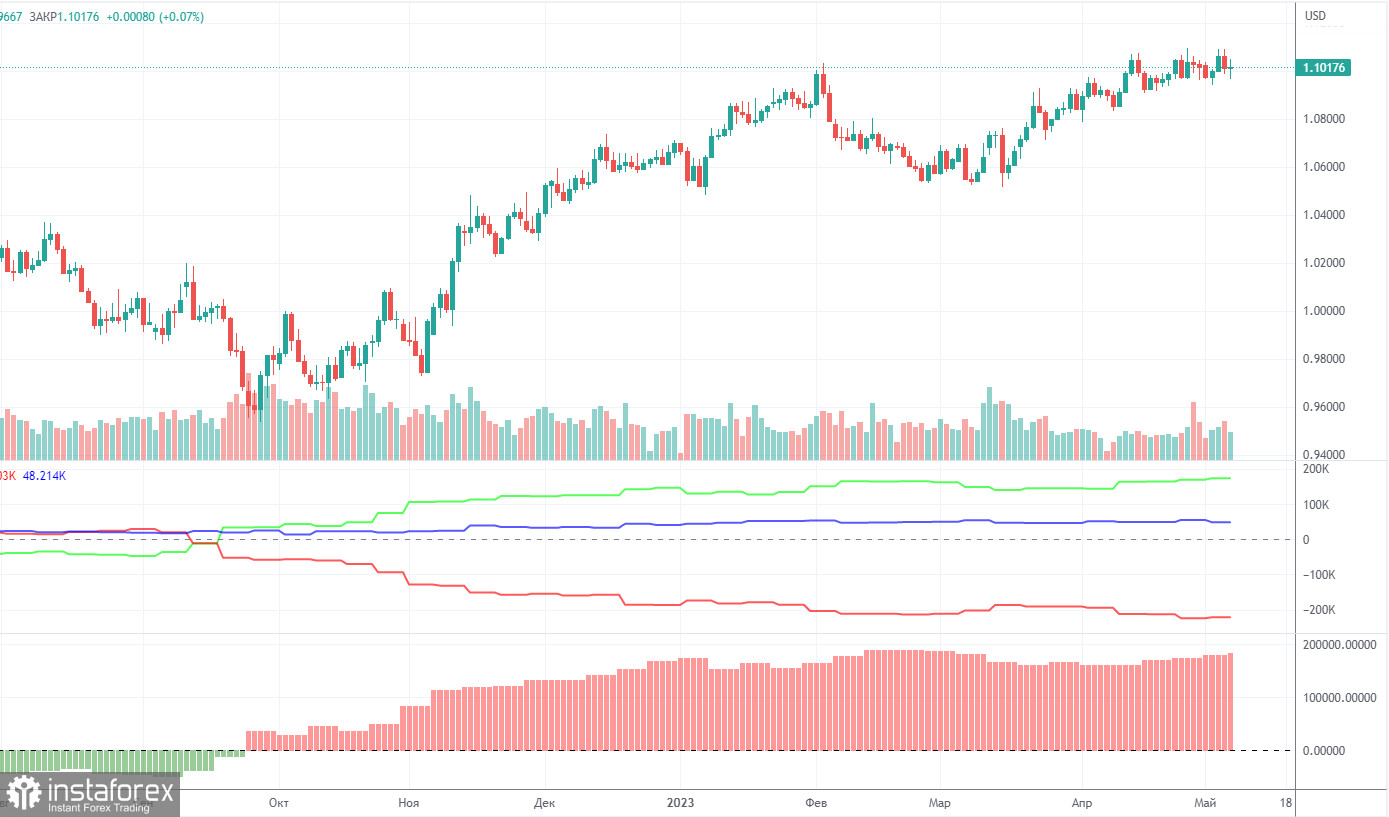
According to the COT report from May 9, released on Friday, the net position (second indicator) has been on the rise since September 2022. In fact, COT data has been in line with the developments in the market over the past 9 months. The euro started to show strength approximately at the same time. Currently, the net non-commercial position is bullish and keeps growing further. Likewise, the euro is bullish and without a possibility of a bearish correction.
Notably, judging by the extremely bullish net position, we may assume that the uptrend may soon stop. The first indicator shows that, and the red and green lines are far away from each other, which is usually a sign that the end of the trend might be nearing. The euro attempted to go down several months ago, but those were just minor pullbacks. In the reporting week, long positions of non-commercial traders increased by 13,500 and short positions grew by 7,500. Consequently, the net position rose by 6,000. The number of long positions exceeds that of short ones by 180,000. A correction is still impending. So, it is clear that the pair may soon go down even without COT reports.
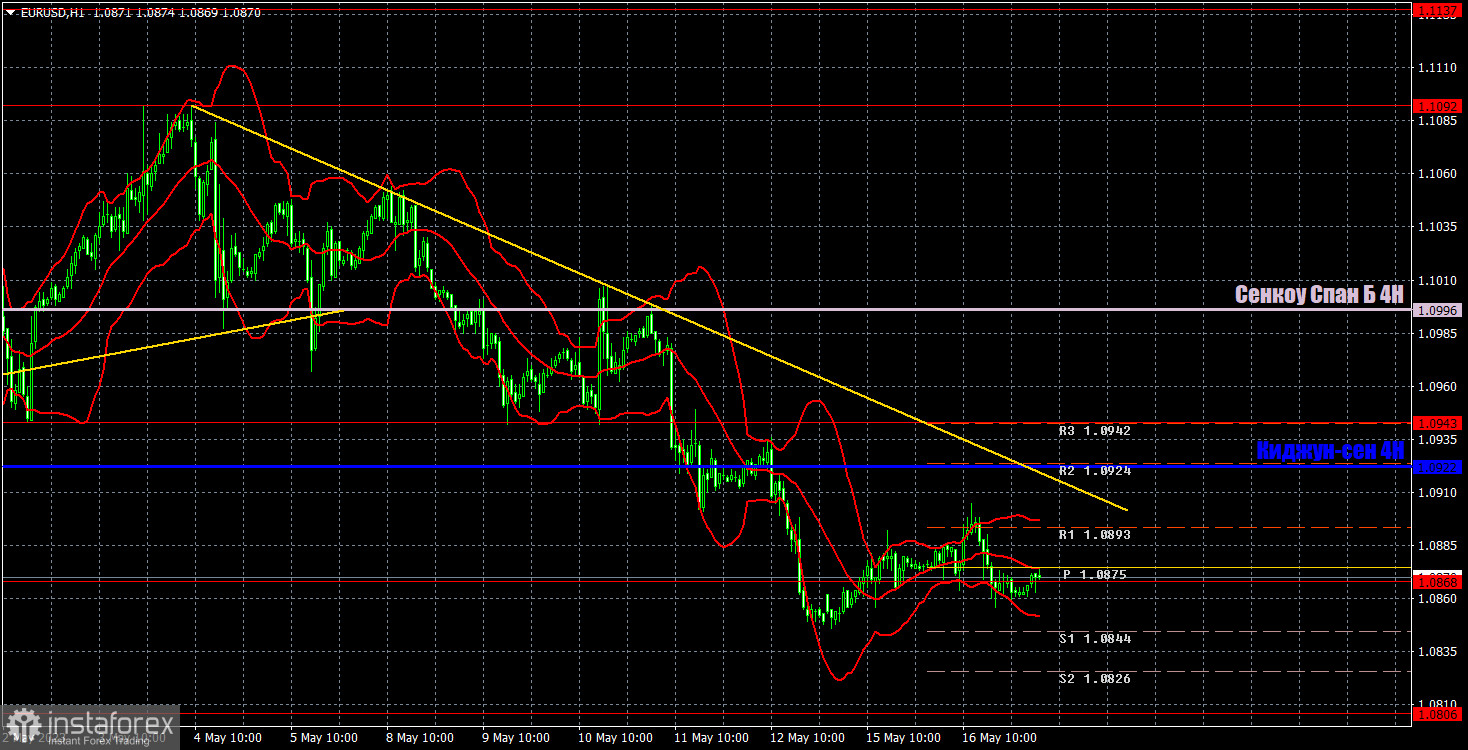
In the 1-hour time frame, the pair is moving down. The move is supported by the trendline. The greenback will likely keep strengthening against the euro because it is still oversold. All technical indicators signal a downtrend. Meanwhile, the fundamental and macroeconomic backdrop will unlikely provide support for the euro in the coming weeks.
On May 17, trading levels are seen at 1.0762, 1.0806, 1.0868, 1.0943, 1.1092, 1.1137-1.1185, 1.1234, Senkou Span B (1.1018), and Kijun-sen (1.0922). Ichimoku indicator lines can move intraday, which should be taken into account when determining trading signals. There are also support and resistance although no signals are made near these levels. Signals could be made when the price either breaks or bounces from these extreme levels. Do not forget to place Stop Loss at the breakeven point when the price goes by 15 pips in the right direction. In case of a false breakout, it could save you from possible losses.
On May 17, the eurozone will see the release of inflation data for April. However, it will be already the second estimate, which means no strong reaction may follow unless statistics miss the 7.0% forecast. In addition, some ECB officials will speak, including Luis de Guindos. In the United States, data on construction will be delivered. All in all, it could be another calm trading day.
Resistance/support - thick red lines, near which the trend may stop. They do not make trading signals.
Kijun-sen and Senkou Span B are the Ichimoku indicator lines moved to the hourly timeframe from the 4-hour timeframe. They are also strong lines.
Extreme levels are thin red lines, from which the price used to bounce earlier. They can produce trading signals.
Yellow lines are trend lines, trend channels, and any other technical patterns.
Indicator 1 on the COT chart is the size of the net position of each trader category.
Indicator 2 on the COT chart is the size of the net position for the Non-commercial group of traders.
InstaForex analytical reviews will make you fully aware of market trends! Being an InstaForex client, you are provided with a large number of free services for efficient trading.

