 Permanecer
Condições de Negociações
Ferramentas


GBP/USD showed some strength on Friday. Unlike the euro, the pound sterling is more resistant. It tends to show a slower decline and stronger growth. On Friday, quotes were supported by Fed Chair Powell's speech although he had said nothing important. The market had expected a rate hike in June. However, Powell's remarks made it clear that there would be no increase. The greenback lost 50 pips. This factor will unlikely contribute to a significant decline in the price of USD. Still, quotes may fall if buying pressure resumes.
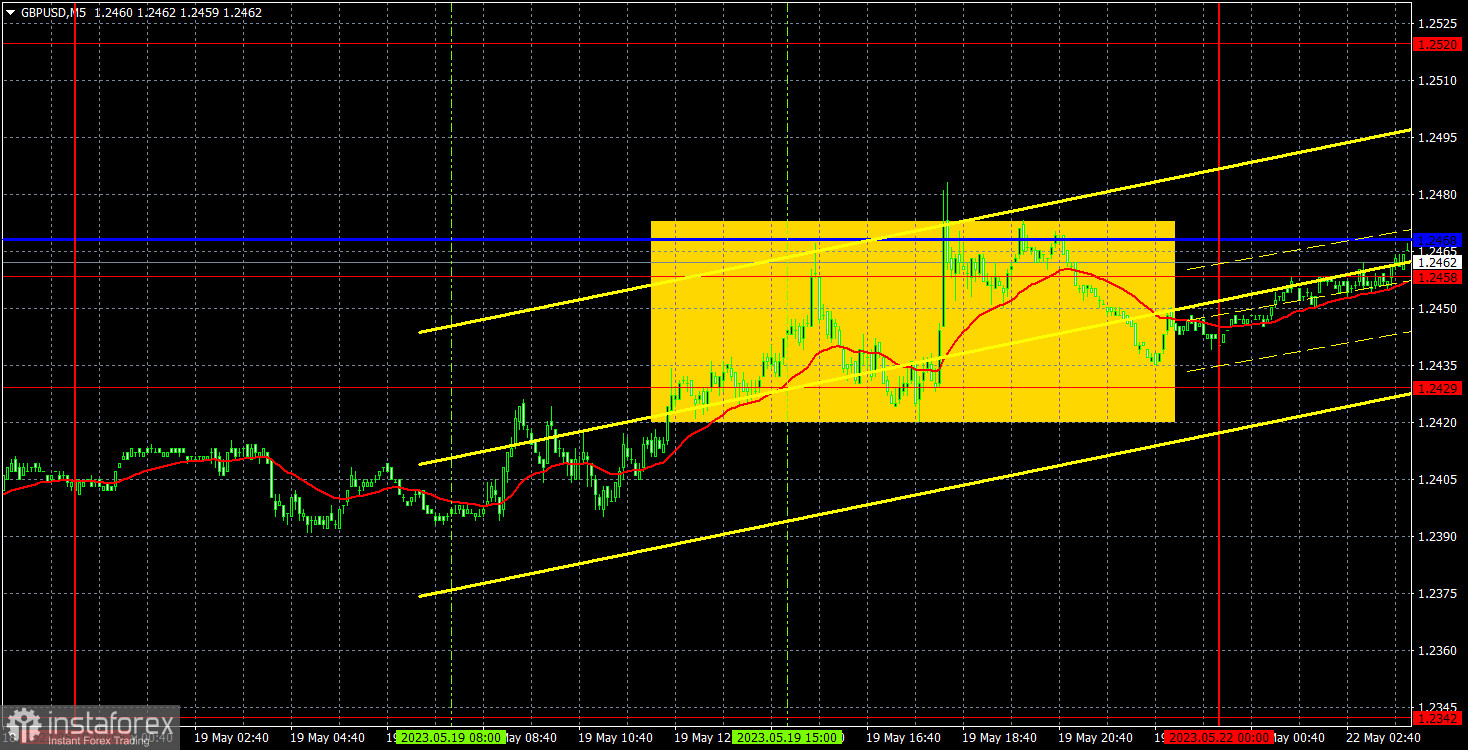
Speaking of trading signals, the price mostly traded in the range of 1.2429-1.2468. Therefore, it was pointless to open positions because levels and lines were located close to each other. Trading between the critical line and the 1.2429 level could have brought just 10 pips of profit. However, risks were extremely high, so it would be unwise to open positions. The downtrend is likely to continue because the price failed to consolidate above the Kijun-sen.
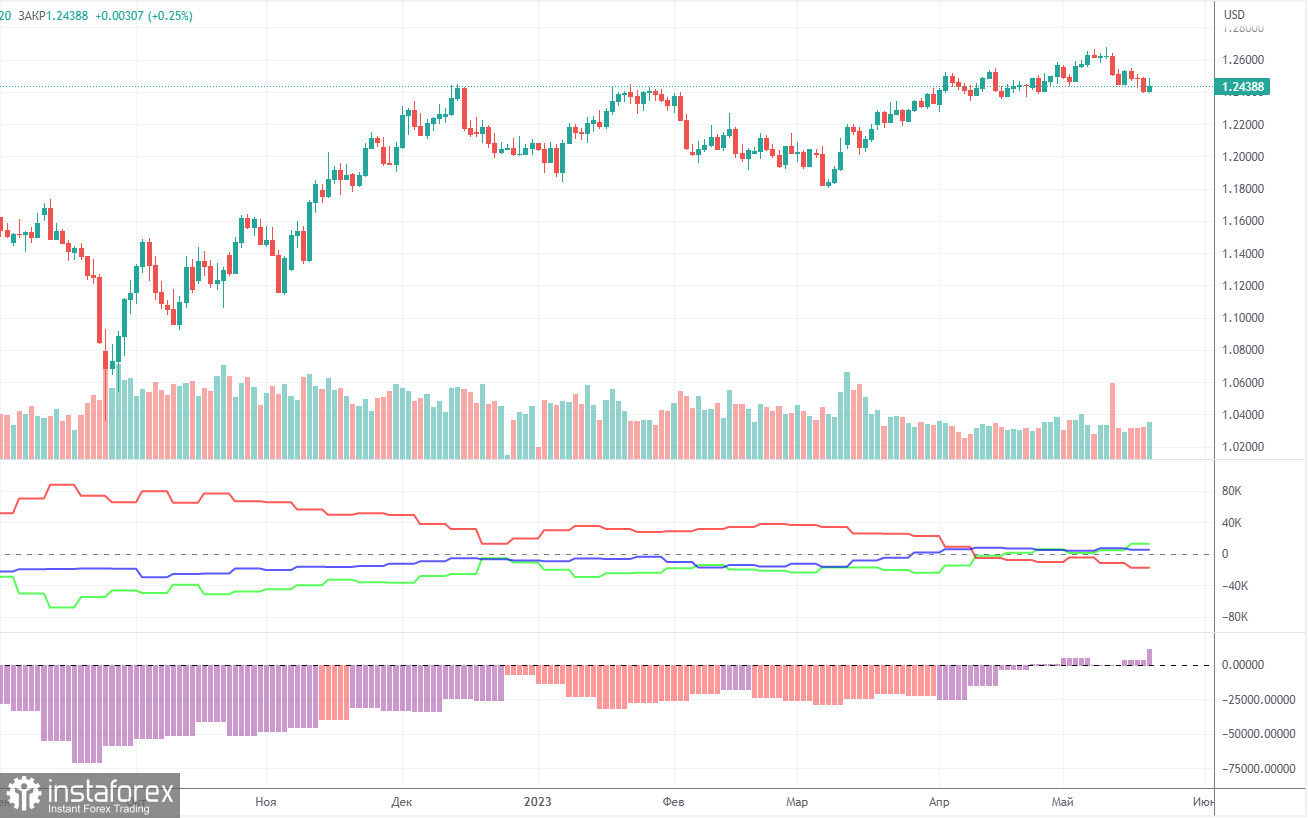
According to the latest report, non-commercial traders opened 5,800 long positions and closed 2,200 short ones. The net positions grew by 8,000 and remained bullish. Over the past 9 months, the net position has been on the rise despite bearish sentiment. The pound is bullish against the greenback in the medium term, and fundamentals hardly explain that. We do not rule out a possibility of a fall in the near term. In fact, it may have already begun.
Both major pairs are in correlation now. At the same time, the positive net position on EUR/USD indicates an impending reversal. Meanwhile, the neutral net position on GBP/USD illustrates a bullish continuation. The pound has gained about 2,300 pips. Therefore, a bearish correction is now needed. Overall, non-commercial traders hold 64,800 sell positions and 77,400 long ones. We do not see the pair extending growth in the long term.
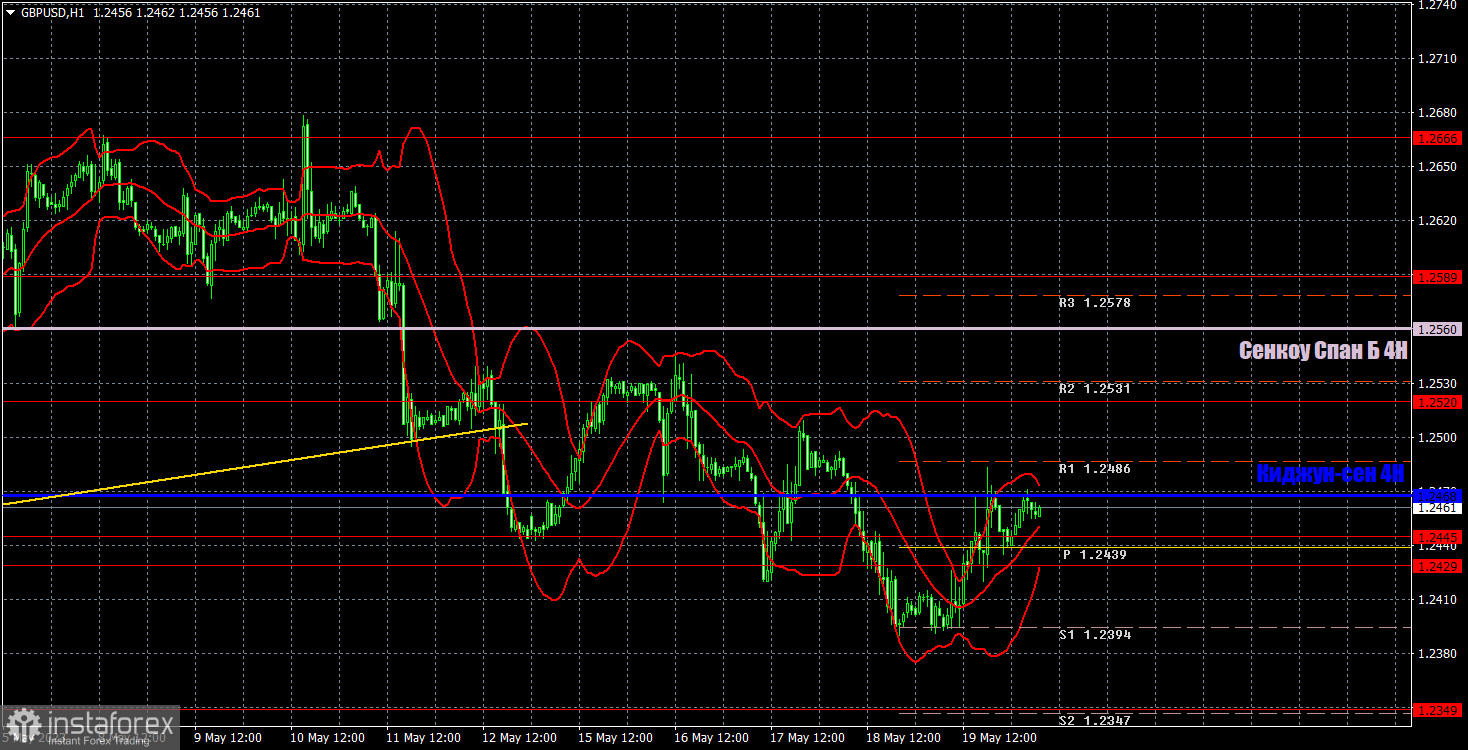
In the H1 time frame, GBP/USD has broken the ascending trendline. The bear movement continues. The price is below the Ichimoku indicator. We will likely see a bearish continuation.
On May 22, trading levels are seen at 1.2269, 1.2349, 1.2429-1.2445, 1.2520, 1.2589, and 1.2666. The Senkou Span B (1.2560) and Kijun-sen (1.2468) may also generate signals when the price either breaks or bounces off them. A Stop Loss should be placed at the breakeven point when the price goes 20 pips in the right direction. Ichimoku indicator lines can move intraday, which should be taken into account when determining trading signals. There are also support and resistance which can be used for locking in profits.
On Monday, the macroeconomic calendar of the UK will be empty. In the US, some Fed officials will speak, including James Bullard. He will likely speak about the need to raise rates further. Still, he can't vote this year. Therefore, his remarks will hardly affect market sentiment.
Resistance/support - thick red lines, near which the trend may stop. They do not make trading signals.
The Kijun-sen and Senkou Span B lines are the Ichimoku indicator lines moved to the hourly timeframe from the 4-hour timeframe. They are also strong lines.
Extreme levels are thin red lines, from which the price used to bounce earlier. They can produce trading signals.
Yellow lines are trend lines, trend channels, and other technical patterns.
Indicator 1 on the COT chart is the size of the net position of each trader category.
Indicator 2 on the COT chart is the size of the net position for the Non-commercial group of traders.
InstaForex analytical reviews will make you fully aware of market trends! Being an InstaForex client, you are provided with a large number of free services for efficient trading.

