 Permanecer
Condições de Negociações
Ferramentas


Analysis of EUR/USD on the 5-minute chart
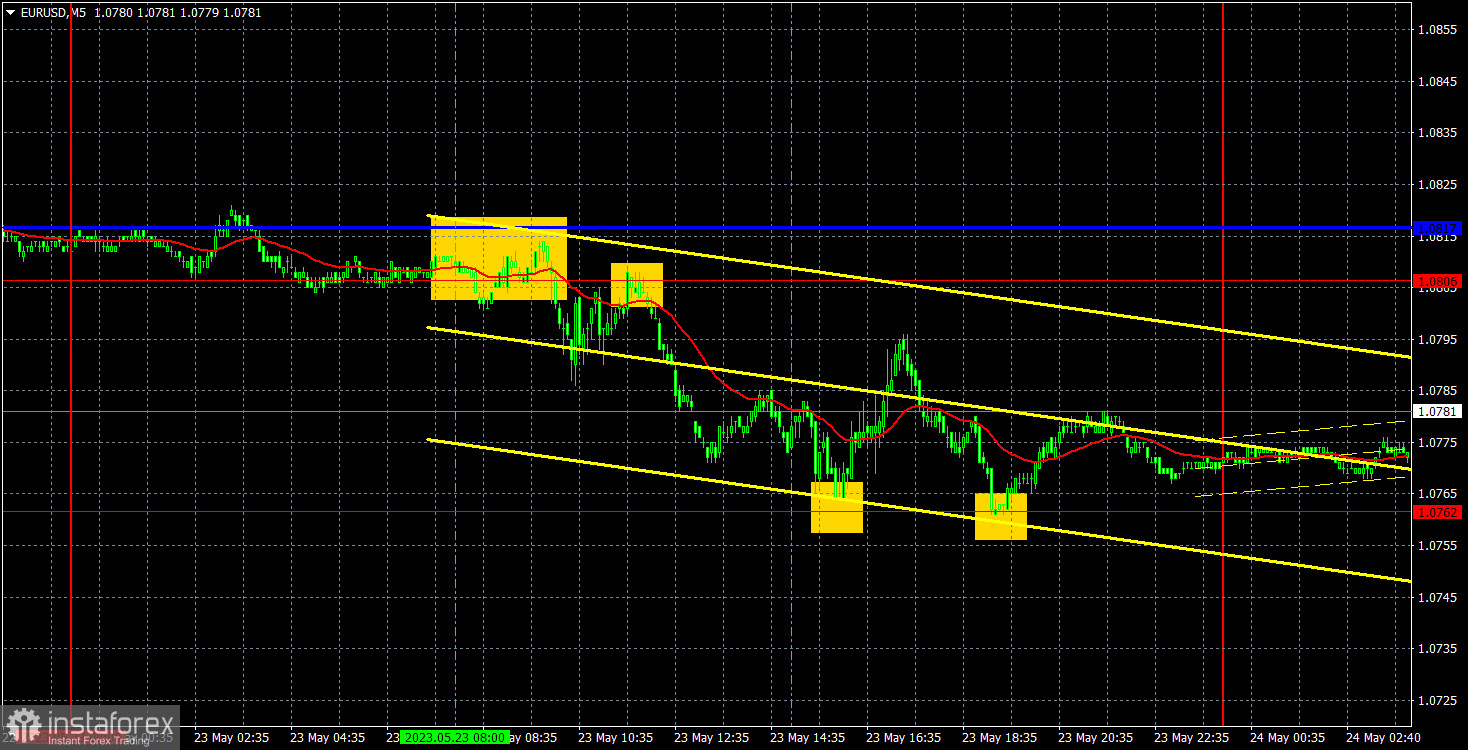
The EUR/USD pair traded lower again during the second trading day of the week, which should not raise any questions. The euro remains overbought and unreasonably expensive. As a result, the market started to stabilize. There are no grounds to buy the euro at the moment. The ECB is also nearing the end of its tightening cycle. In addition, macroeconomic data from the European Union is weaker than that from the United States. By the way, reports on business activity were published in both the United States and the EU yesterday. Overall, they were very similar to each other. However, in the first half of the day, the euro fell due to weak figures on the manufacturing PMI, while in the second half of the day, the dollar only pretended to decline because of similar data. Thus, the current market sentiment is bearish, which is very good.
There were few trading signals on Tuesday. Initially, the pair bounced twice from the level of 1.0806, forming two sell signals. The signals duplicated each other, so there should have been only one short position. Subsequently, the pair dropped to the nearest target of 1.0762 and bounced off it. The profit from the trade was about 20 pips. The buy signal did not result in profit as the pair only managed to rise by 20 pips and returned back to 1.0762. The stop loss was triggered at breakeven. The last buy signal formed too late.
COT Report:
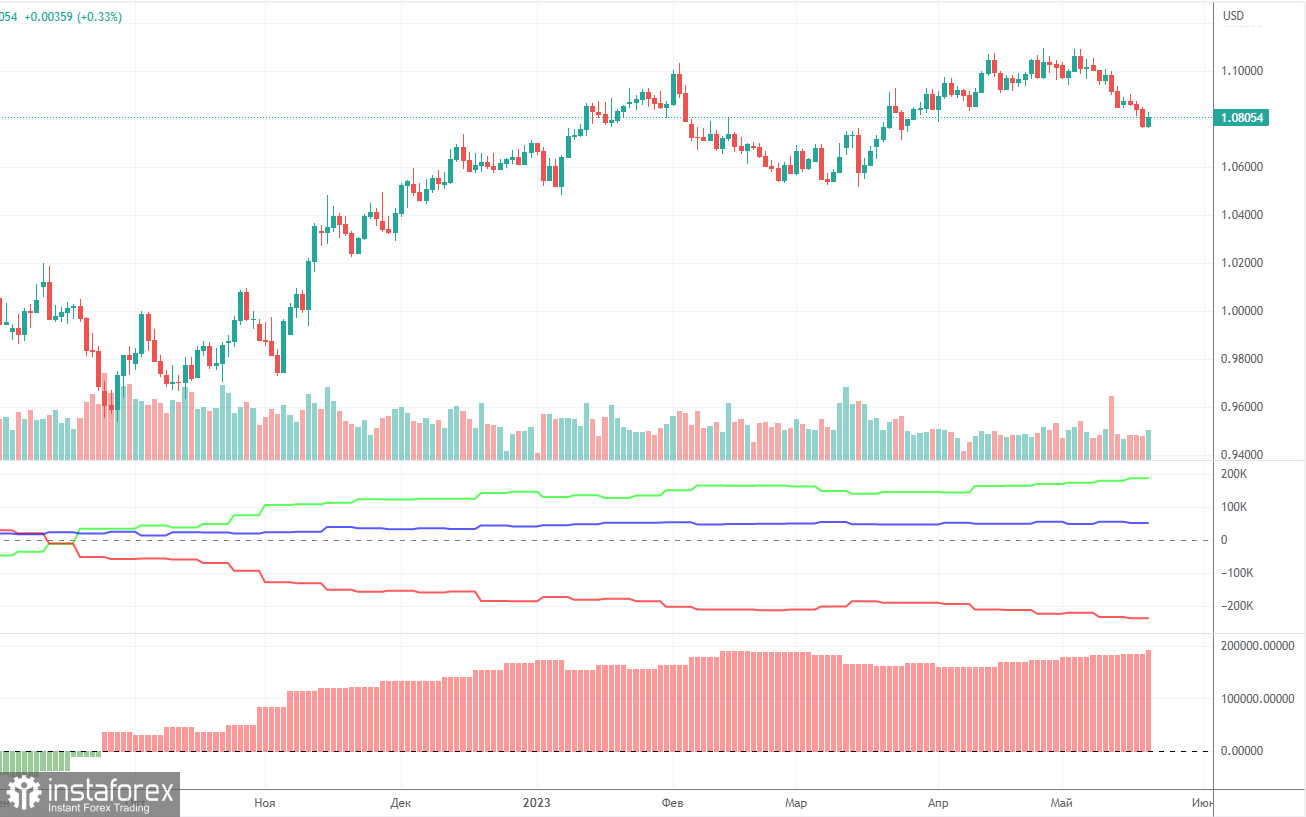
On Friday, a new COT report was released for May 16th. Over the past 9 months, the COT report data has been fully corresponding to the market situation. According to the chart, the net position of large traders (the second indicator) started to rise in September 2022. Around the same time, the European currency also began to rise. Currently, the net position of non-commercial traders, the bullish position, remains very high and continues to rise, just like the European currency itself.
We have already drawn traders' attention to the fact that a relatively high value of the net position suggests the imminent end of the uptrend. This is indicated by the first indicator, where the red and green lines are far away from each other, which often precedes the end of a trend. The euro attempted to start declining a few months ago, but we only saw a not very strong pullback. During the last reporting week, the number of buy contracts among the non-commercial group decreased by 1.6 thousand, while the number of short positions dropped by 9.6 thousand. Accordingly, the net position jumped again by 8 thousand contracts. The number of buy contracts exceeds the number of sell contracts among non-commercial traders by 187 thousand. This is a very large gap. The difference is more than threefold. The correction is still looming (and perhaps already underway), so even without the COT reports, it is clear that the pair should decline.
Analysis of EUR/USD on the 1-hour chart
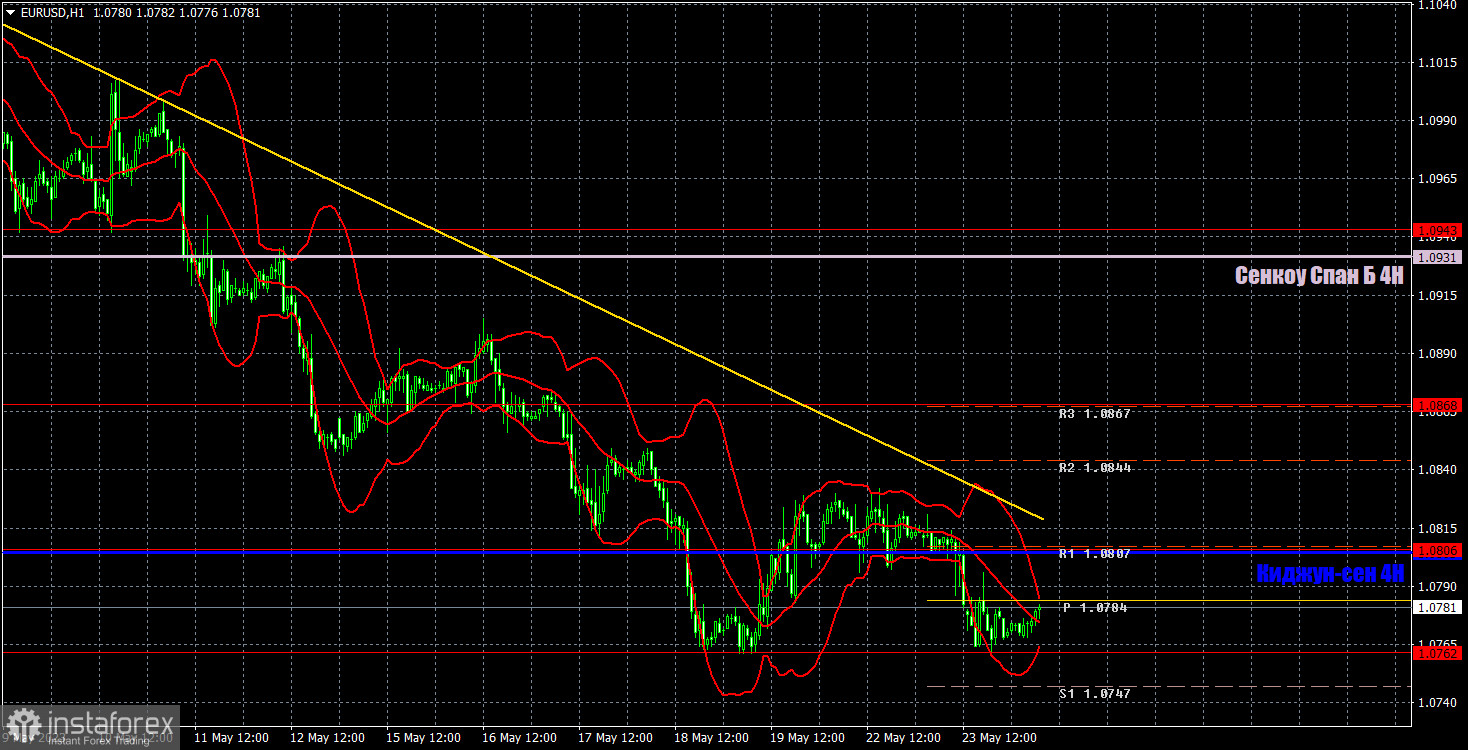
On the hourly time frame, the pair continues its downward movement, supported by the trendline. We expect a further rise in the US dollar, but the pair is currently unable to overcome the level of 1.0762. Consolidation above the trendline and the critical line could signal a start of a new upward trend, but in the medium term, we still anticipate a decline.
For May 24th, we highlight the following levels for trading: 1.0581, 1.0658-1.0669, 1.0762, 1.0806, 1.0868, 1.0943, 1.1092, 1.1137-1.1185, as well as the Senkou Span B line (1.0931) and the Kijun-sen line (1.0805). The lines of the Ichimoku indicator may move throughout the day, so this should be taken into account when determining trading signals. There are also support and resistance levels, but no signals are formed around them. Bounces and breakouts of key levels and lines can also give signals. Don't forget to set a stop loss order at breakeven if the price moves in the right direction by 15 pips. This will protect against potential losses if the signal turns out to be false.
Today, the macroeconomic calendar is empty in the European Union and the United States. Traders may pay attention only to Christine Lagarde's speech and the minutes of the latest Federal Reserve meeting. Both of these events are scheduled for the evening, so they will not have any impact on those who trade intraday based on our advice. The pair's volatility remains very low.
What do we see on the trading chart:
Support and resistance levels (resistance/support) are thick red lines where price movement may end. They are not sources of trading signals.
Kijun-sen and Senkou Span B lines are lines of the Ichimoku indicator transferred from the 4-hour time frame to the hourly time frame. They are strong lines.
Extreme levels are thin red lines from which the price previously rebounded. They are sources of trading signals.
Yellow lines are trendlines, trend channels, and any other technical patterns.
Indicator 1 on the COT chart reflects the size of the net position for each category of traders.
Indicator 2 on the COT charts points to the size of the net position for the non-commercial group.
InstaForex analytical reviews will make you fully aware of market trends! Being an InstaForex client, you are provided with a large number of free services for efficient trading.

