 Permanecer
Condições de Negociações
Ferramentas


On Tuesday, GBP/USD experienced almost no losses and even tried to rise at the beginning of Wednesday. Thus, the pound remains more resilient compared to the euro. Although it has been declining in the past two weeks, it does so reluctantly, as if indicating that these are temporary difficulties and that the bullish trend is still intact. Take note of Bank of England Governor Andrew Bailey's announcement yesterday. He mentioned a stronger monetary policy due to high inflation resistance, which could have supported the British pound. However, even his statement could not restore the uptrend for the pound. After a corrective rebound, I expect the pound to fall further. By the way, the UK's PMIs from yesterday turned out to be a disappointment, as all three slowed down in May.
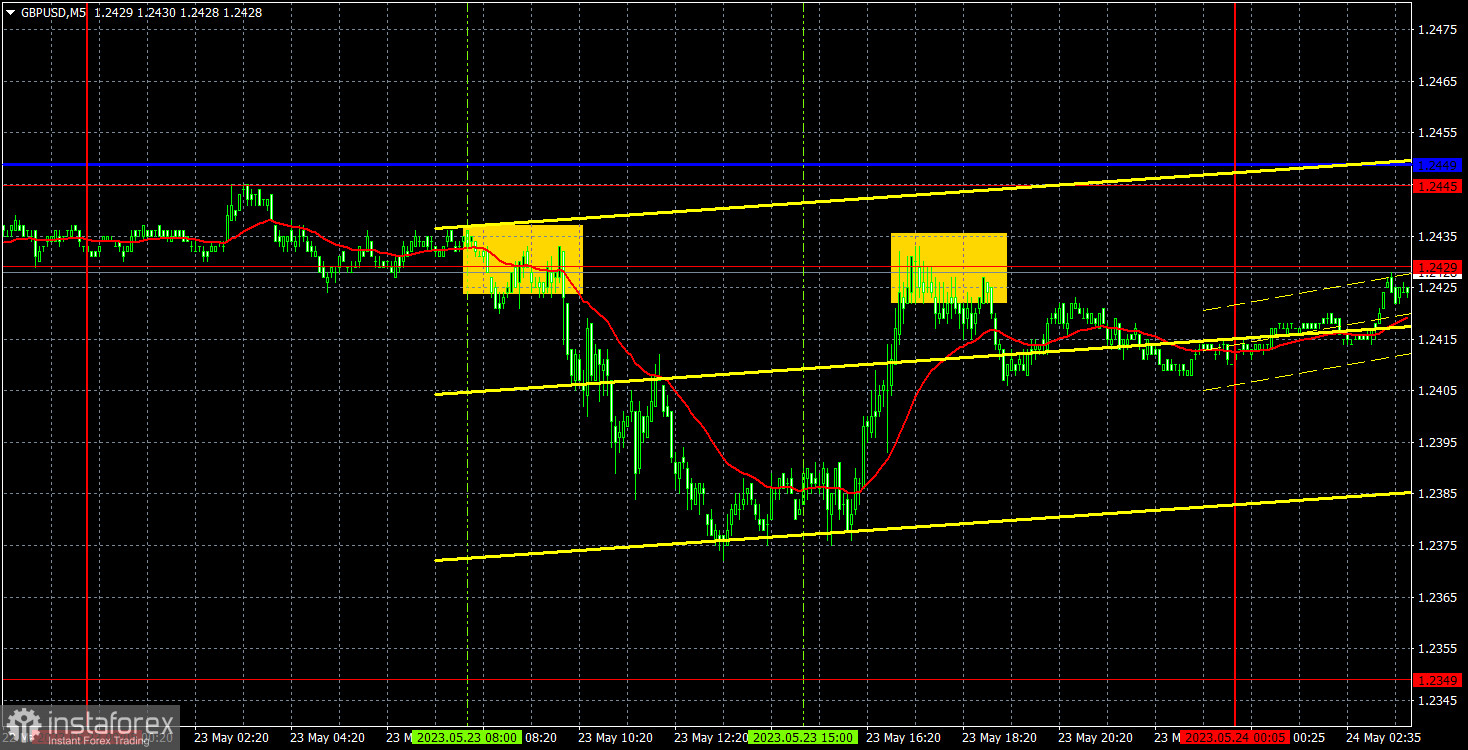
Yesterday, there were two trading signals. The pair bounced off the 1.2429 level in both cases. In the first instance, it managed to fall by about 50 pips but still failed to reach the nearest target level. Since volatility has recently been low, traders could have manually closed this trade, although it was not an obvious decision. We believe that the trade closed with a breakeven stop-loss when the pair returned to 1.2429. The second bounce was formed too late, and even if traders took advantage of it, the profit could have been at most 10 pips.
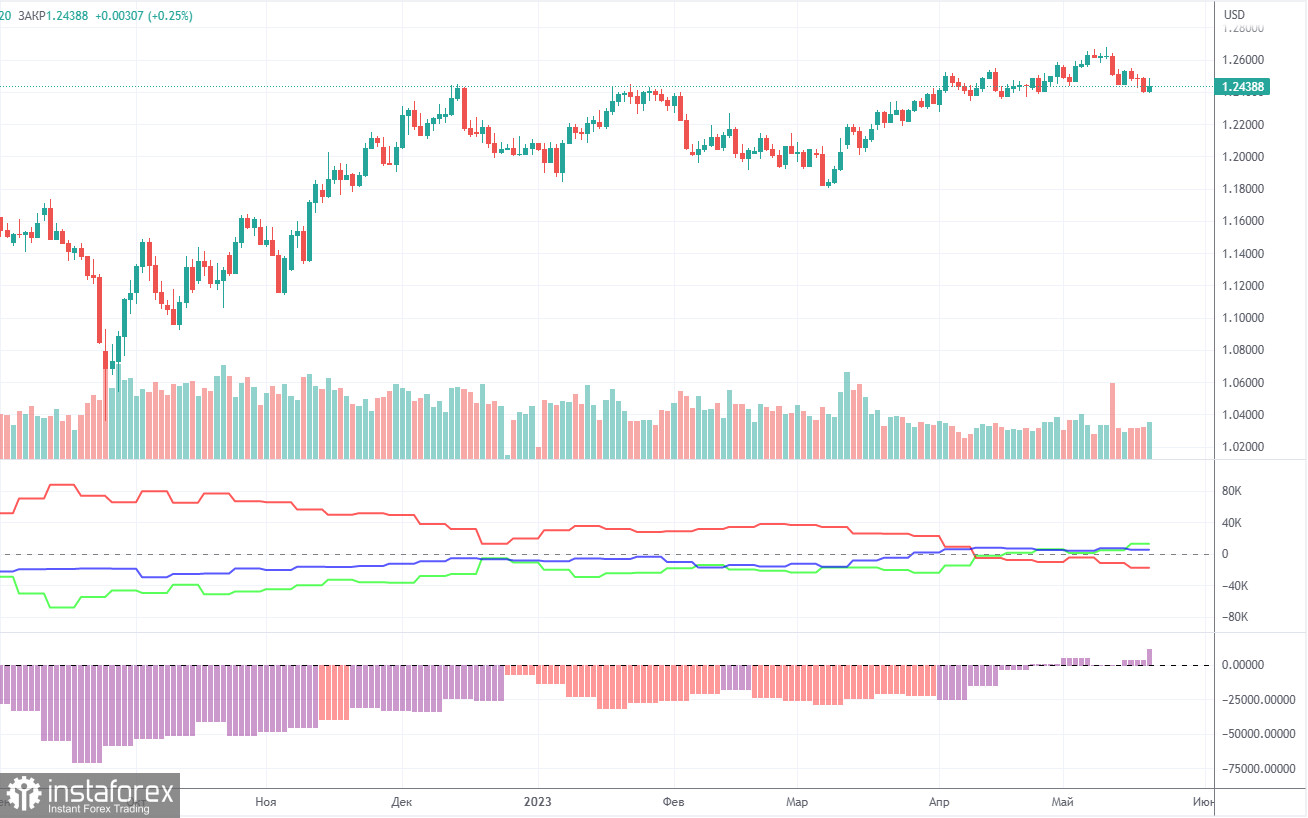
According to the latest report, non-commercial traders opened 5,800 long positions and closed 2,200 short ones. The net positions grew by 8,000 and remained bullish. Over the past 9 months, the net position has been on the rise despite bearish sentiment. The pound is bullish against the greenback in the medium term, and fundamentals hardly explain that. We do not rule out a possibility of a fall in the near term. In fact, it may have already begun.
Both major pairs are in correlation now. At the same time, the positive net position on EUR/USD indicates an impending reversal. Meanwhile, the neutral net position on GBP/USD illustrates a bullish continuation. The pound has gained about 2,300 pips. Therefore, a bearish correction is now needed. Overall, non-commercial traders hold 64,800 sell positions and 77,400 long ones. We do not see the pair extending growth in the long term.
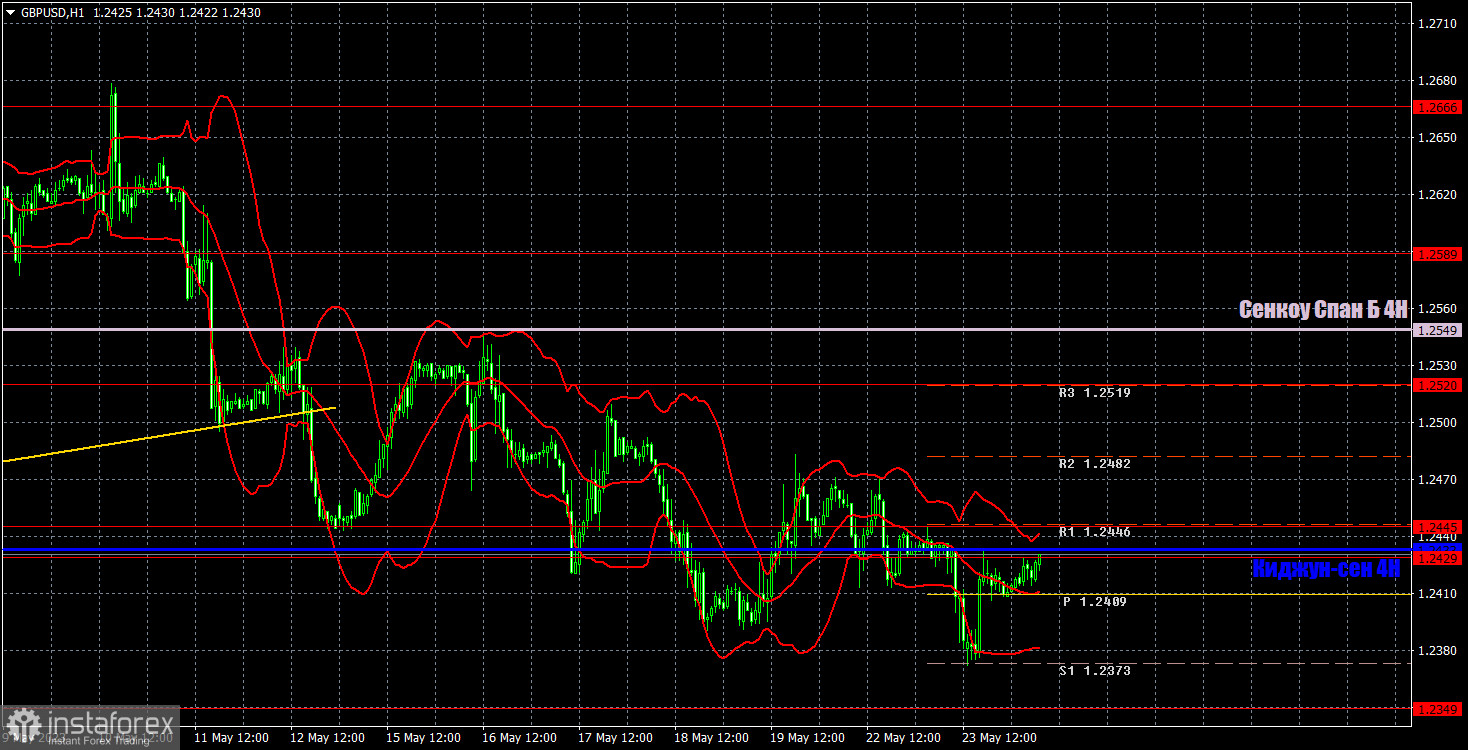
In the 1-hour time frame, the pair has breached the ascending trendline. The bearish movement persists. The price is below the Ichimoku indicator, which allows us to be hopeful about the current trend. I should mention that we still believe that the pair should extend its downward movement, but for now, the market is experiencing a pause, flat, calmness, and low volatility.
On May 24, trading levels are seen at 1.2269, 1.2349, 1.2429-1.2445, 1.2520, 1.2589, 1.2666. The Senkou Span B line (1.2549) and the Kijun-sen line (1.2433) may also generate signals when the price either breaks or bounces off them. A Stop Loss should be placed at the breakeven point when the price goes 20 pips in the right direction. Ichimoku indicator lines can move intraday, which should be taken into account when determining trading signals. There are also support and resistance which can be used for locking in profits.
On Wednesday, Bailey will deliver another speech in the UK, most likely in Parliament, but in front of a different committee. It is unlikely for Bailey to change his stance in just a day. However, an inflation report will be published in just an hour, which can mark the first significant slowdown in the indicator. Therefore, volatility may rise, but the pound's movement will depend on the nature of the report.
Resistance/support - thick red lines, near which the trend may stop. They do not make trading signals.
The Kijun-sen and Senkou Span B lines are the Ichimoku indicator lines moved to the hourly timeframe from the 4-hour timeframe. They are also strong lines.
Extreme levels are thin red lines, from which the price used to bounce earlier. They can produce trading signals.
Yellow lines are trend lines, trend channels, and other technical patterns.
Indicator 1 on the COT chart is the size of the net position of each trader category.
Indicator 2 on the COT chart is the size of the net position for the Non-commercial group of traders.
InstaForex analytical reviews will make you fully aware of market trends! Being an InstaForex client, you are provided with a large number of free services for efficient trading.


