 Permanecer
Condições de Negociações
Ferramentas


GBP/USD accelerates on Friday. Yesterday, there were no significant events lined up in the UK, but the US data turned out to be slightly weaker than expected. Reports on unemployment claims and industrial production were worse than traders' expectations, but there were also reports that exceeded forecasts (retail sales). Therefore, if the US data were not in favor of the dollar, it was not to the extent that it would fall by 140 pips in a day. On the other hand, the European Central Bank held its meeting, the results of which had no relation to the pound. In addition, the market had already expected its results a couple of weeks ago, if not more. And despite all that the pound still rallied, even more strongly than the euro. Thus, the pound extends its illogical growth.
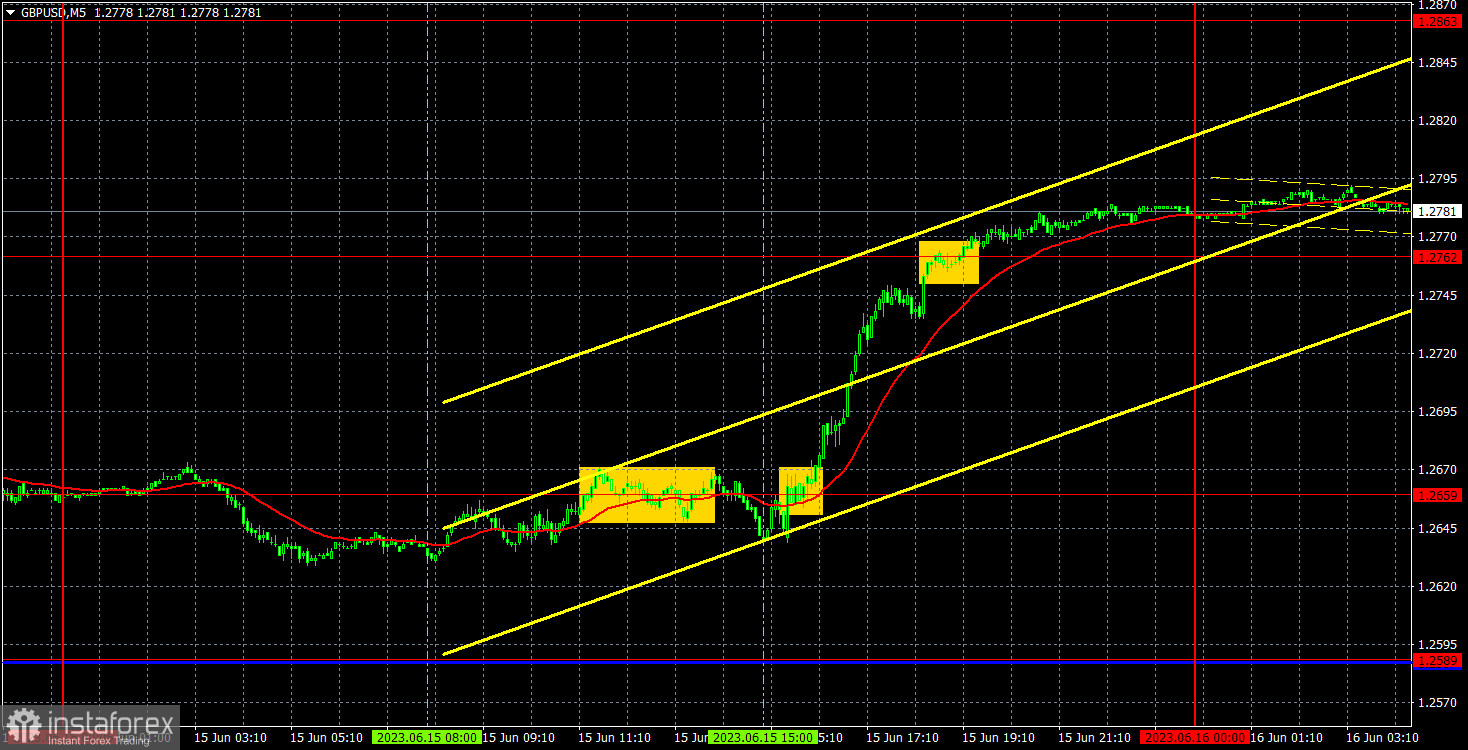
The first sell signal near the 1.2659 level turned out to be false. The price could not move in the right direction even by 20 pips, so the short position closed with a small loss at the beginning of the US trading session when a buy signal appeared. Later, the pair confidently rose to the 1.2762 level and surpassed it. No sell signals were formed for the rest of the day, so traders could close their long positions anywhere. The profit from this trade amounted to at least 100 pips.
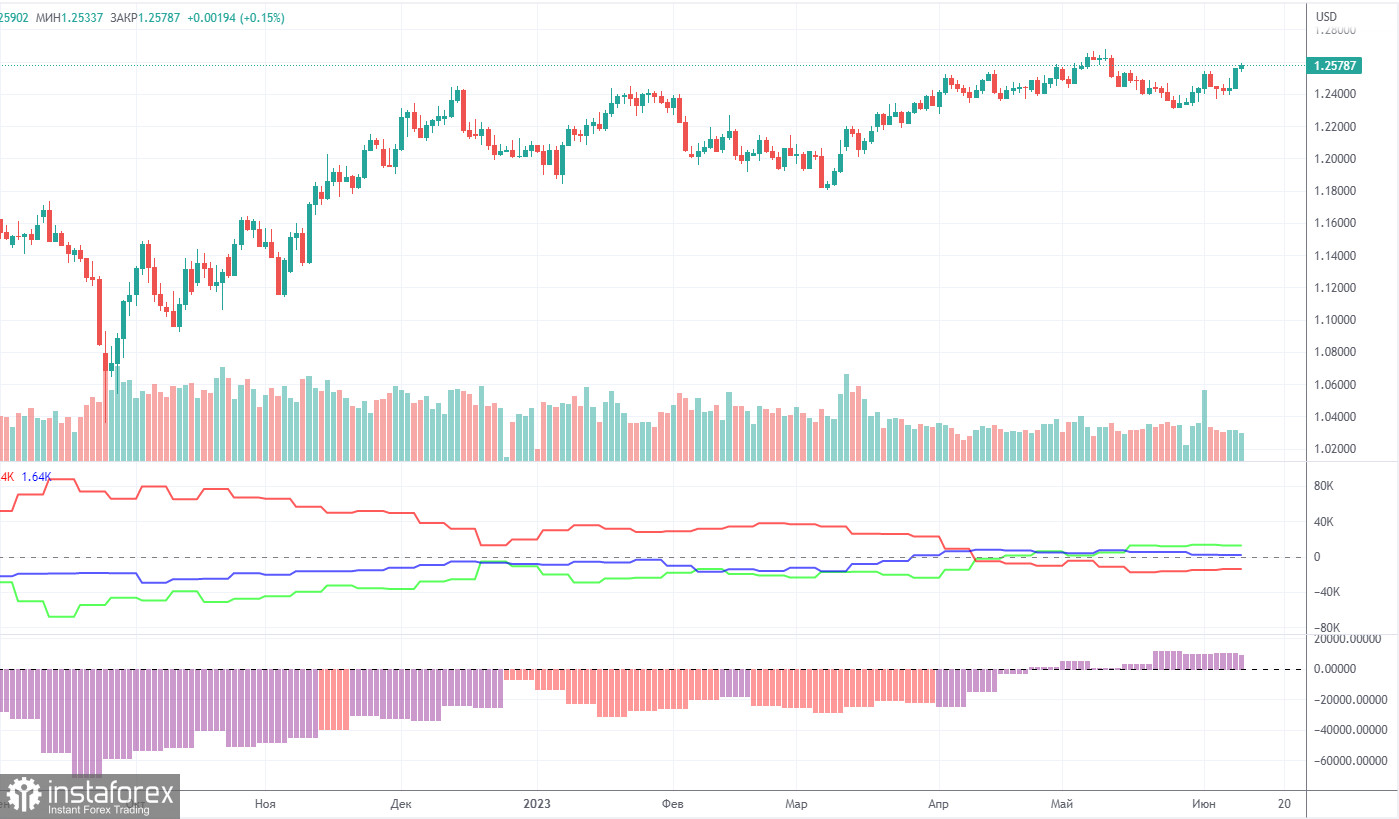
According to the latest report, non-commercial traders closed 5,200 long positions and 4,500 short ones. The net position dropped by 700 but remained bullish. Over the past 9-10 months, the net position has been on the rise despite bearish sentiment. In fact, sentiment is now bullish, but it is a pure formality. The pound is bullish against the greenback in the medium term, but there have been hardly any reasons for that. We assume that a prolonged bear run may soon begin even though COT reports suggest a bullish continuation. However, we can hardly explain why the uptrend should go on.
The pound has gained about 2,300 pips. Therefore, a bearish correction is now needed. Otherwise, a bullish continuation would make no sense even despite the lack of support from fundamental factors. Overall, non-commercial traders hold 52,500 sell positions and 65,000 long ones. We do not see the pair extending growth in the long term.
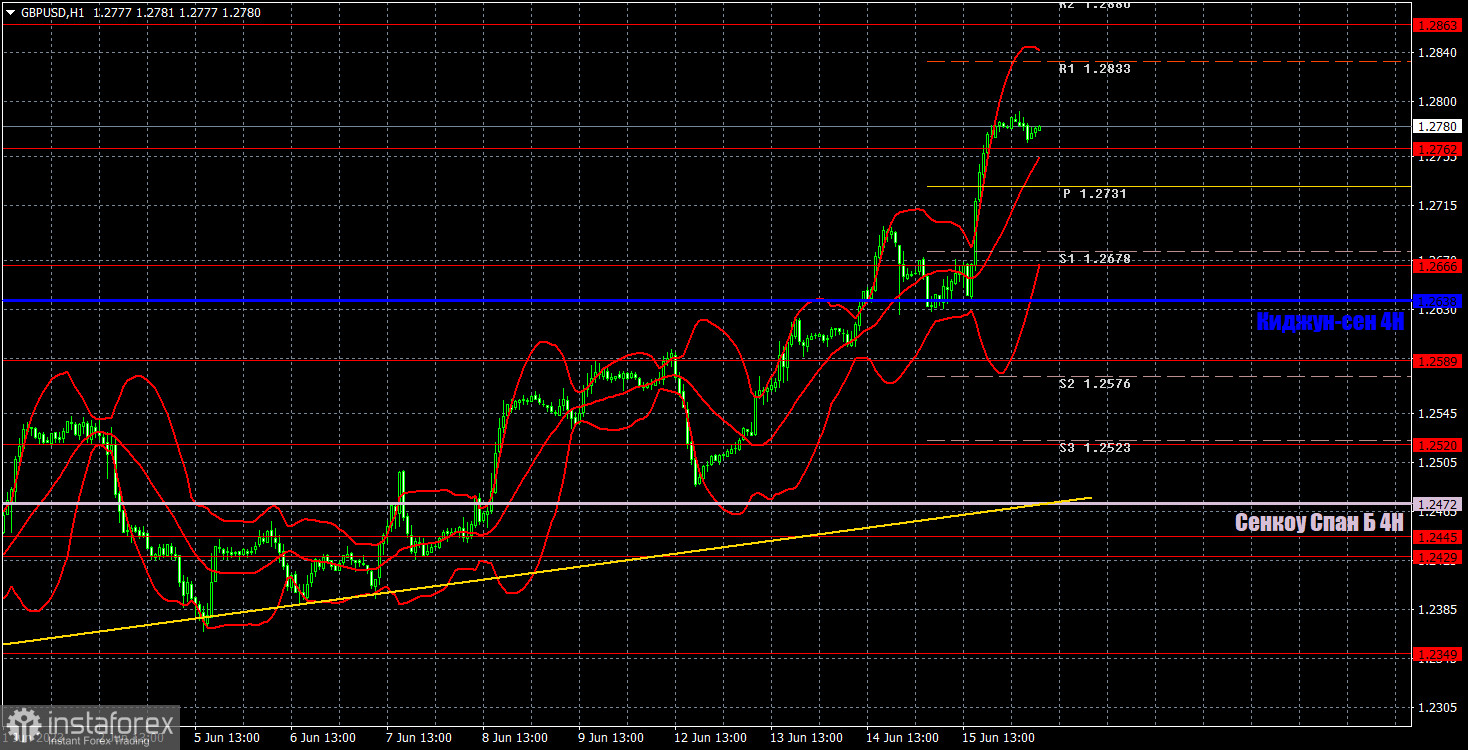
In the 1-hour chart, maintains a bullish bias. The ascending trend line serves as a buy signal but I believe that further growth of the British currency is groundless. The pound sterling has been climbing for too long and downward corrections are short-lived. Judging by the technical indicators, we have an uptrend. Yet, it is hard to find the reasons which may push it higher. Nevertheless, the market has no logical reason to buy at the moment.
On June 16, trading levels are seen at 1.2349, 1.2429-1.2445, 1.2520, 1.2589, 1.2666, 1.2762, 1.2863, 1.2981-1.2987. The Senkou Span B line (1.2472) and the Kijun-sen line (1.2638) may also generate signals when the price either breaks or bounces off them. A Stop Loss should be placed at the breakeven point when the price goes 20 pips in the right direction. Ichimoku indicator lines can move intraday, which should be taken into account when determining trading signals. There are also support and resistance which can be used for locking in profits.
On Friday, there are no important events lined up in the UK, while the US will only release the University of Michigan Consumer Sentiment Index. Since there are no significant events today, we might witness a slight bearish correction. However, the pound can still rise since it doesn't need any logical reason behind it.
Resistance/support - thick red lines, near which the trend may stop. They do not make trading signals.
The Kijun-sen and Senkou Span B lines are the Ichimoku indicator lines moved to the hourly timeframe from the 4-hour timeframe. They are also strong lines.
Extreme levels are thin red lines, from which the price used to bounce earlier. They can produce trading signals.
Yellow lines are trend lines, trend channels, and other technical patterns.
Indicator 1 on the COT chart is the size of the net position of each trader category.
Indicator 2 on the COT chart is the size of the net position for the Non-commercial group of traders.
InstaForex analytical reviews will make you fully aware of market trends! Being an InstaForex client, you are provided with a large number of free services for efficient trading.

