 Permanecer
Condições de Negociações
Ferramentas


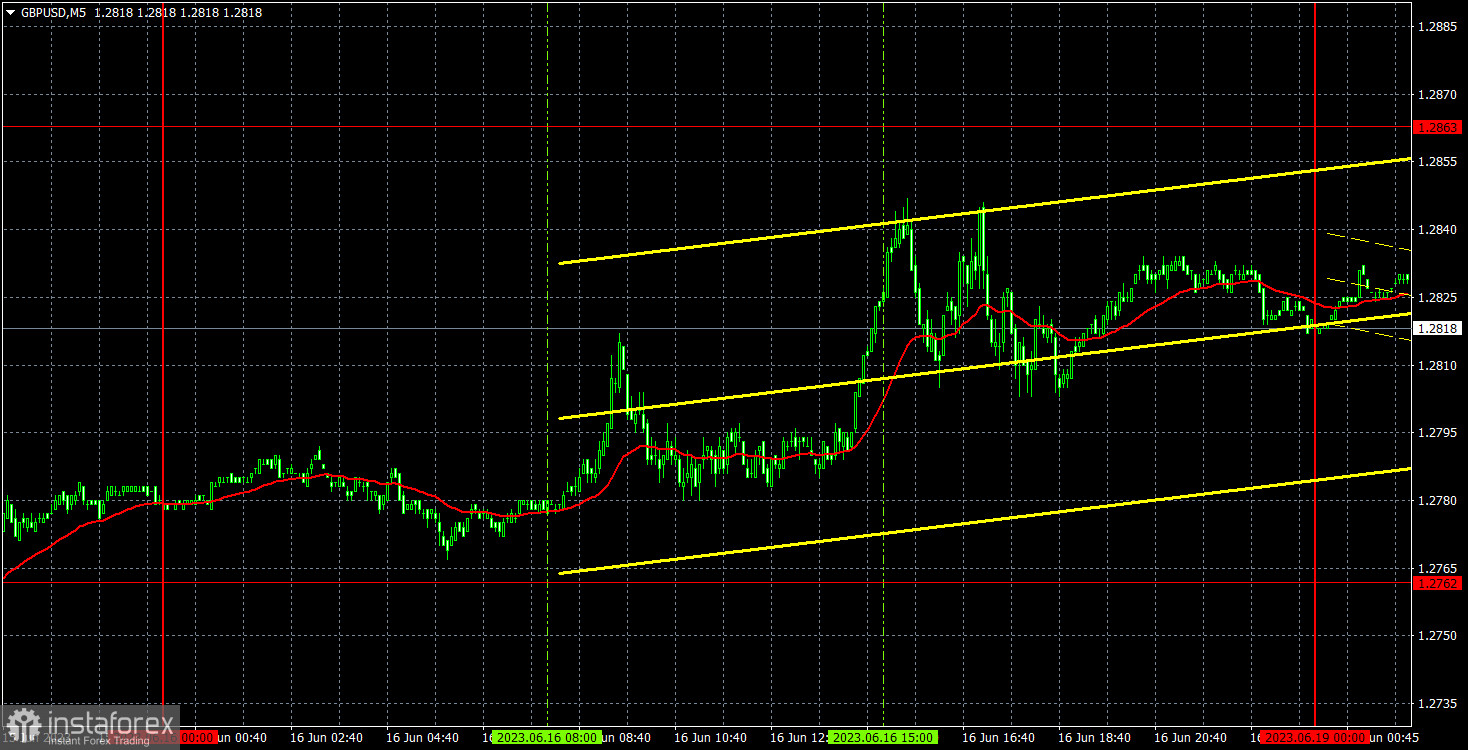
GBP/USD moved higher again on Friday. Despite having only one relatively significant report throughout the day, the pound climbed steadily higher even during the European session. The volatility was not too strong, but even with an empty macroeconomic calendar, the demand for the pound continued to rise. We have repeatedly mentioned that the pound's growth has been groundless, and it has been rising for several months now. In our fundamental articles, we discuss why this may be happening, but in this article we will only mention that the upward movement is illogical, but that doesn't mean that you shouldn't trade the pair. Although the pair's growth raises many questions, traders can still work things out when there are strong signals.
There were no trading signals on Friday. The pair did approach the level of 1.2762 during the Asian trading session, but ultimately failed to reach it. We believe that the absence of signals on that day was more of a good thing than a bad thing. Look at the nature of the pair's movement throughout the day: constant reversals and low volatility. If there were any levels or lines in the pair's path, false signals would have been unavoidable.
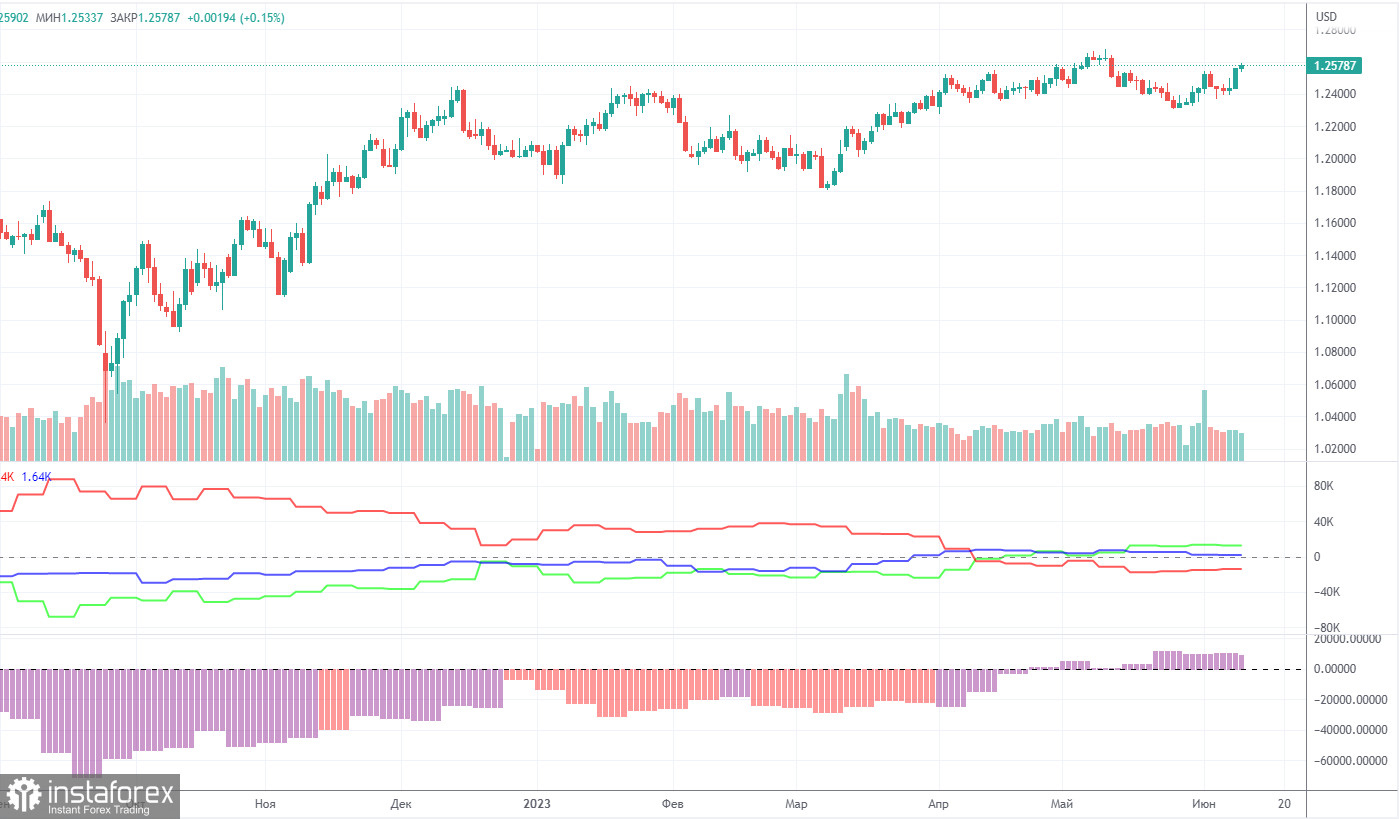
According to the latest report, non-commercial traders closed 5,200 long positions and 4,500 short ones. The net position dropped by 700 but remained bullish. Over the past 9-10 months, the net position has been on the rise despite bearish sentiment. In fact, sentiment is now bullish, but it is a pure formality. The pound is bullish against the greenback in the medium term, but there have been hardly any reasons for that. We assume that a prolonged bear run may soon begin even though COT reports suggest a bullish continuation. However, we can hardly explain why the uptrend should go on.
The pound has gained about 2,300 pips. Therefore, a bearish correction is now needed. Otherwise, a bullish continuation would make no sense even despite the lack of support from fundamental factors. Overall, non-commercial traders hold 52,500 sell positions and 65,000 long ones. We do not see the pair extending growth in the long term.
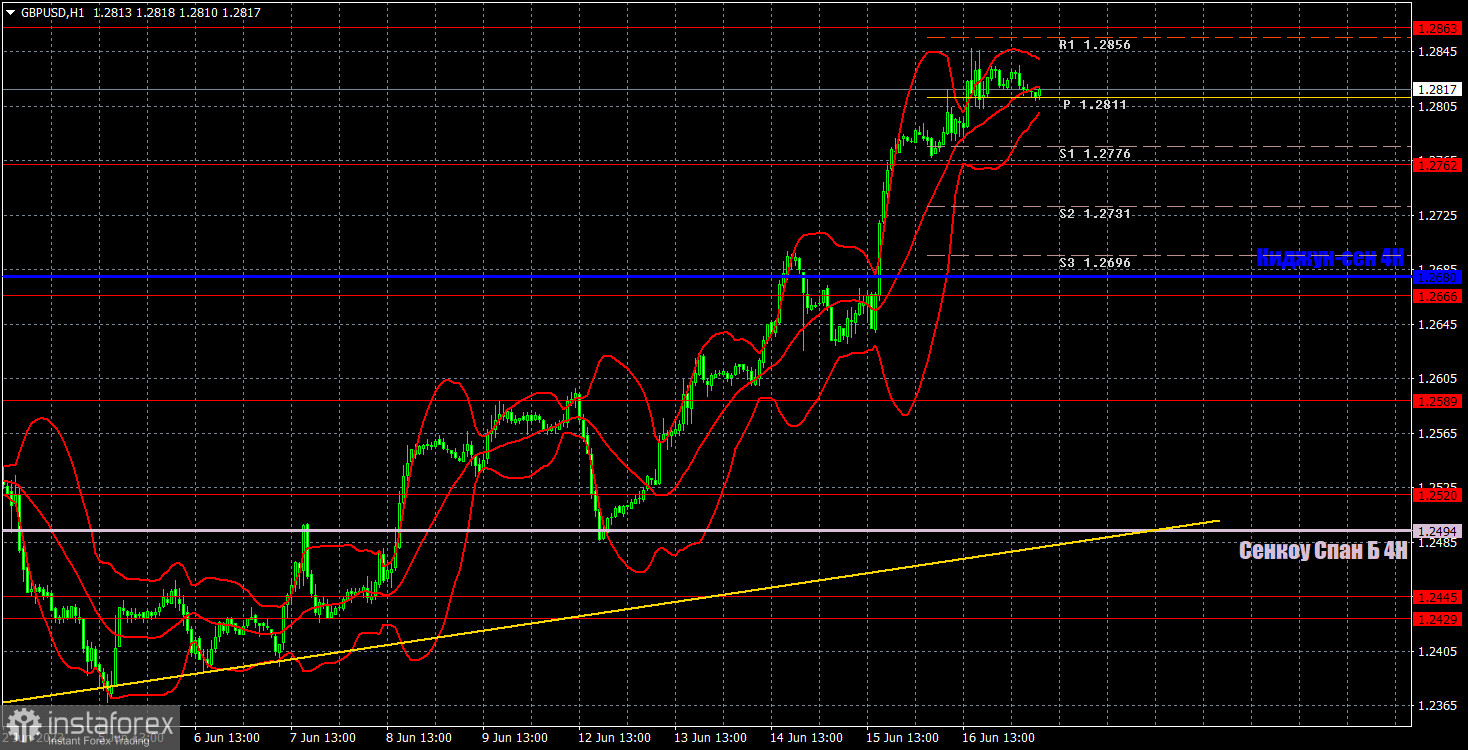
In the 1-hour chart, GBP/USD maintains a bullish bias. The ascending trend line serves as a buy signal but I believe that further growth of the British currency is groundless. The pound sterling has been climbing for too long and downward corrections are short-lived. Judging by the technical indicators, we have an uptrend. Yet, it is hard to find the reasons which may push it higher. However, it is naturally not advisable to sell the pair without proper signals.
On June 19, trading levels are seen at 1.2349, 1.2429-1.2445, 1.2520, 1.2589, 1.2666, 1.2762, 1.2863, 1.2981-1.2987. The Senkou Span B line (1.2494) and the Kijun-sen line (1.2680) may also generate signals when the price either breaks or bounces off them. A Stop Loss should be placed at the breakeven point when the price goes 20 pips in the right direction. Ichimoku indicator lines can move intraday, which should be taken into account when determining trading signals. There are also support and resistance which can be used for locking in profits.
In the US and the UK, there are no significant events lined up. However, this week, there will be "high-profile" events that can lead to significant movement. In particular, Powell's speeches in Congress and the Bank of England's meeting. And the market currently doesn't need much to increase demand for the pound.
Resistance/support - thick red lines, near which the trend may stop. They do not make trading signals.
The Kijun-sen and Senkou Span B lines are the Ichimoku indicator lines moved to the hourly timeframe from the 4-hour timeframe. They are also strong lines.
Extreme levels are thin red lines, from which the price used to bounce earlier. They can produce trading signals.
Yellow lines are trend lines, trend channels, and other technical patterns.
Indicator 1 on the COT chart is the size of the net position of each trader category.
Indicator 2 on the COT chart is the size of the net position for the Non-commercial group of traders.
InstaForex analytical reviews will make you fully aware of market trends! Being an InstaForex client, you are provided with a large number of free services for efficient trading.


