 Permanecer
Condições de Negociações
Ferramentas


At the annual economic symposium in Jackson Hole, Jerome Powell, the head of the Federal Reserve System, delivered a speech with anticipated rhetoric. His speech can be characterized as moderately negative, where he confirmed the Fed's intentions to continue raising the interest rate as necessary.
Key points from the Fed chairman's speech:
The regulator is ready to raise rates even more actively if it is deemed appropriate.
The Fed intends to maintain rates at a restrictive level until inflation consistently falls to 2%.
Regarding the possibility of further rate hikes, "we will proceed with caution."
The positive economic data from the past two months is just the beginning of what is required to bolster confidence in the inflation level.
The decision on a future rate hike will be data-driven.
The Fed is "closely monitoring" signs that the economy is not cooling as anticipated.
Further progress in non-housing-related service inflation is necessary.
The Fed does not plan to change its inflation target of 2%.

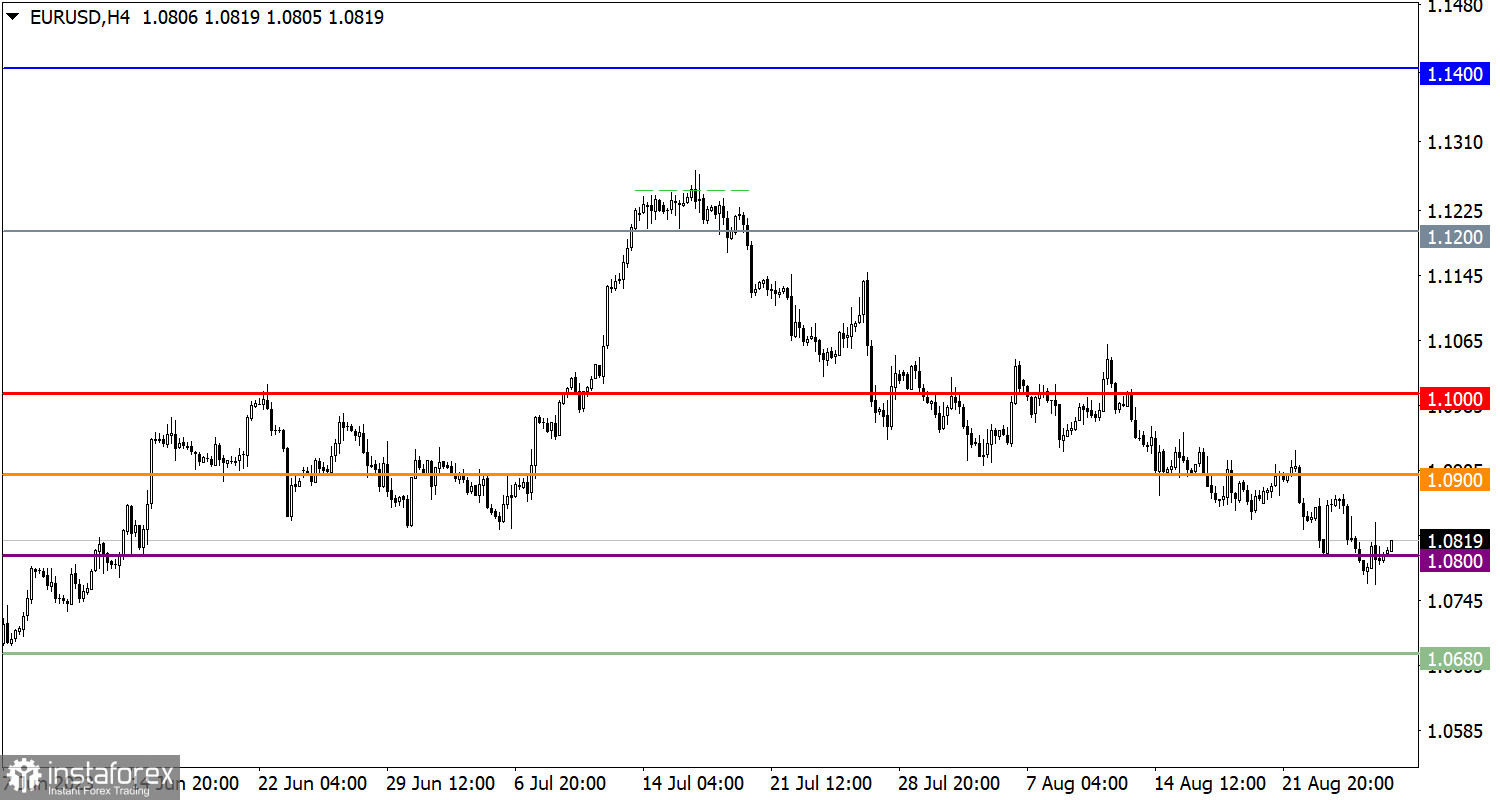
The EUR/USD rate broke through the 1.0800 support level, but failed to sustain at the new quote values. This factor led to a reduction in short positions, subsequently causing a price pullback.
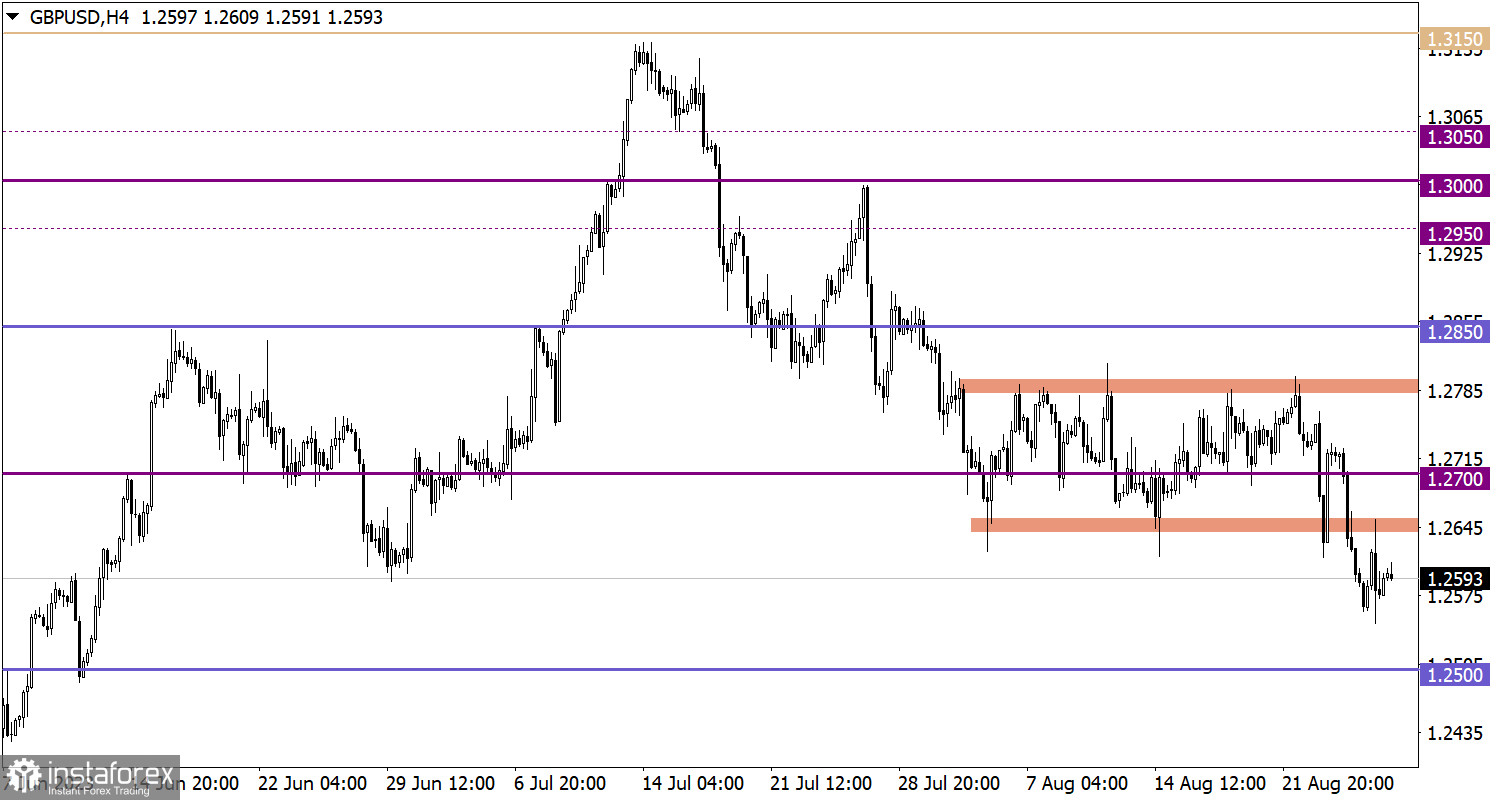
The GBP/USD currency pair completed the formation of the sideways channel 1.2650/1.2800 last week, breaking its lower boundary. As a result, the quote locally dropped below the 1.2550 level, but later rebounded to the previously surpassed level.
Monday, as usual, is accompanied by an empty macroeconomic calendar. No major statistical data releases are expected in the European Union, the United Kingdom, or the United States.
Given this, investors and traders are likely to focus on the information received from the Jackson Hole symposium on Friday.
A sustained price drop below the 1.0800 level may trigger a further increase in short positions. In such a scenario, there is a possibility of forming a continuing correction cycle directed towards the local low set in May. However, the current pullback may also represent an initial technical signal indicating the end of the correction cycle. In this context, a price rebound above the 1.0850 level may trigger a gradual increase in long positions in the euro.
Despite the local increase in long positions, the market still has a bearish sentiment. For this reason, a consistent decline in price below the 1.2600 level could lead to an increase in short positions. However, if the price returns above the 1.2700 mark, the bearish cycle may be disrupted, leading to the beginning of a new phase of sideways price fluctuation.
The candlestick chart type is white and black graphic rectangles with lines above and below. With a detailed analysis of each individual candle, you can see its characteristics relative to a particular time frame: opening price, closing price, intraday high and low.
Horizontal levels are price coordinates, relative to which a price may stop or reverse its trajectory. In the market, these levels are called support and resistance.
Circles and rectangles are highlighted examples where the price reversed in history. This color highlighting indicates horizontal lines that may put pressure on the asset's price in the future.
The up/down arrows are landmarks of the possible price direction in the future.
InstaForex analytical reviews will make you fully aware of market trends! Being an InstaForex client, you are provided with a large number of free services for efficient trading.


