 Permanecer
Condições de Negociações
Ferramentas


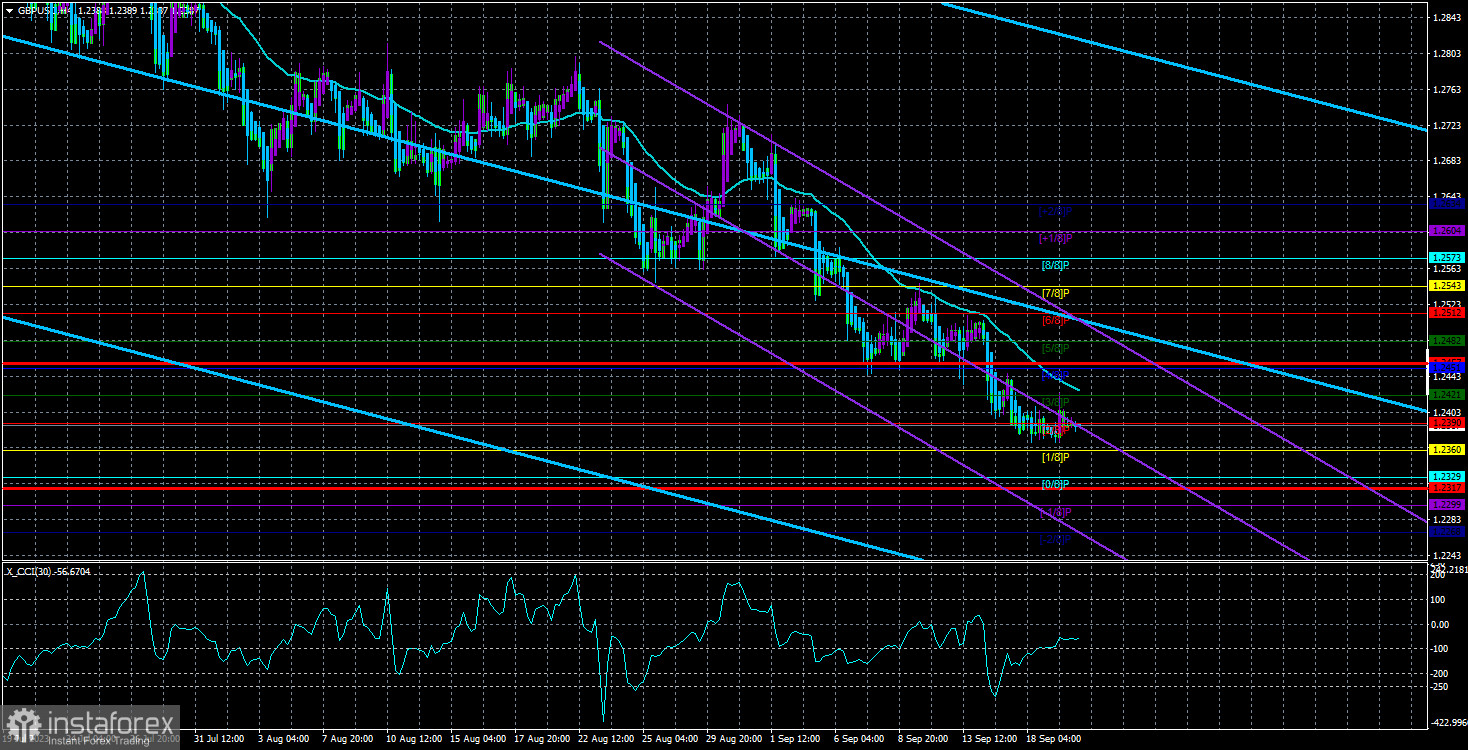
The GBP/USD currency pair corrected towards the moving average line on Wednesday and quickly resumed its downward movement. Naturally, the new decline of the British currency was solely provoked by the outcome of the Fed meeting, not even by the actual results, but rather by the fact of such an event as the Fed meeting. In our article on EUR/USD, we already discussed why there were no significant reasons for the dollar to show growth yesterday. The FOMC rate remained unchanged. It could still rise this year and has been known to everyone for a long time. Jerome Powell did not make any "ultra-hawkish" statements. Therefore, we concluded that the American currency has an inertia-driven rise, which should be followed by a correction soon.
If the CCI indicator entered the oversold zone twice for the euro, it can be said that it has done it three times already for the pound. Yesterday's drop brought the indicator down to almost the -250 level, which can be considered an entry into the oversold zone, albeit with some stretch. Thus, the indicator entered the oversold zone three times in just over a month. Each subsequent indicator minimum was higher than the previous one, and each subsequent price minimum was lower. This means we have a whole series of divergences that predict a rise in the pair. In addition to this, the British pound has been falling for two years, so there should at least be a small pause.
However, today, we would rather support a new decline in the British currency than its rise. Recall that the ECB raised its key rate last Thursday, but the euro fell. This happened because all rate hikes by the ECB and the Bank of England were already priced in by the market long ago. Accordingly, today, the Bank of England may also raise rates, but the pound may still fall. And if the British regulator takes an unexpected pause, there will be even more reasons for the market to sell the pound.
The Bank of England needs to be helping the pound.
In principle, there is nothing more to speculate about regarding the possible decisions of the Bank of England. We want to remind traders that the market's reaction can be anything. And then (post-factum), almost any pair movement can be explained. For example, if the pound falls, everyone will say that the Bank of England was not tough and "hawkish" enough. If the pound rises, it can be said that the market saw "hawkish" notes in Andrew Bailey's statement. In reality, all of this is just an explanation. No one can predict how the market will react to an event whose outcome still needs to be discovered. Guessing is possible, but we are not going to guess.
Moreover, we advise market participants not to rush into trading decisions. The current situation is such that the pound may continue its inertia-driven decline. Still, a correction may also start, which is signaled by more and more indicators with each passing day. Trying to enter the market immediately after announcing the Bank of England meeting results is pure suicide. In just two hours, the price can change direction five times, as the market will trade on emotions.
Therefore, watching the developments from the sidelines may be best until the market calms down. And then conclude. If, for example, the pound stabilizes above the moving average on Friday, this will be good support for a correction. Also, the British pound has worked out an important level of 1.2304 (50.0% Fibonacci) on the 24-hour chart, from which a rebound may occur, leading to a reversal in the upward correction. However, in the medium term, we still expect further declines in the British currency, so it may be better to wait for the correction to be completed and then open short positions again. But today, it is not advisable to rush into trading.
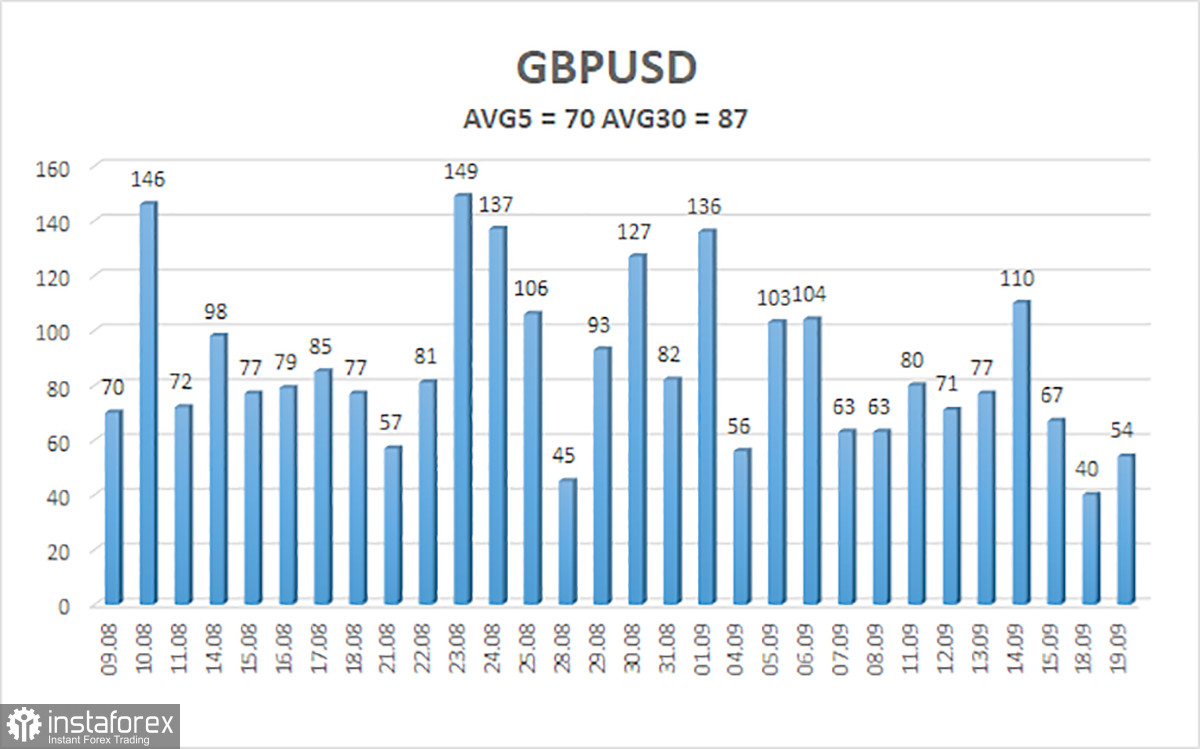
The average volatility of the GBP/USD pair over the last five trading days is 72 points. For the pound/dollar pair, this value is considered average. Therefore, on Thursday, September 21, we expect movement within the range limited by the levels of 1.2246 and 1.2390. A reversal of the Heiken Ashi indicator upwards will signal a new upswing in the upward correction.
Nearest support levels:
S1 - 1.2299;
S2 - 1.2268.
Nearest resistance levels:
R1 - 1.2329;
R2 - 1.2360;
R3 - 1.2390.
Trading recommendations:
On the 4-hour timeframe, the GBP/USD pair continues to hover near its local lows and regularly updates them. Therefore, at the moment, it is advisable to stay in short positions with targets at 1.2268 and 1.2246 until the price is established above the moving average. Long positions can be considered no earlier than after the price is confirmed above the moving average line, with targets at 1.2451 and 1.2482.
Explanations for the illustrations:
Linear regression channels help determine the current trend. If both are pointing in the same direction, it indicates a strong trend;
The moving average line (settings 20.0, smoothed) determines the short-term trend and the direction in which trading should be conducted;
Murray levels are target levels for movements and corrections;
Volatility levels (red lines) represent the likely price channel in which the pair will trade over the next day based on current volatility indicators;
The CCI indicator - its entry into the oversold zone (below -250) or overbought zone (above +250) indicates that a trend reversal in the opposite direction is approaching.
InstaForex analytical reviews will make you fully aware of market trends! Being an InstaForex client, you are provided with a large number of free services for efficient trading.


