 Permanecer
Condições de Negociações
Ferramentas


Data on the labor market in the United Kingdom was published, and the unemployment rate stood at 4.2%, which was lower than the expected 4.3%. However, it's worth noting that the number of jobless claims rose by over 20,000 in September, surpassing expectations by 2,000. Employment figures for August also improved, which fell by 82,000 compared to the 207,000 in July, versus the expected 198,000.
However, the main focus of investors was on preliminary data regarding business activity in the European Union, the United Kingdom, and the United States.
Eurozone services PMI fell from 48.7 to 47.8, while an increase to 49.1 was expected. The manufacturing index fell from 43.4 to 43.0 instead of the expected rise to 43.8. This led to a drop in the composite business activity index from 47.2 to 46.5, falling short of the expected 47.6. These weak indicators exerted pressure on the euro.
In the UK, the service sector business activity index fell from 49.3 to 49.2, although an increase to 49.8 was expected. However, the manufacturing index increased from 44.3 to 45.2, surpassing the expected 44.9. As a result, the composite business activity index rose from 48.5 to 48.6 but remained below the expected 49.1.
These data also put pressure on the British pound.
In the United States, the indices exceeded expectations. The services PMI rose from 50.1 to 50.9 instead of the expected decline to 49.8. The manufacturing index increased from 49.8 to 50.0, surpassing the expected 49.5. This led to an increase in the composite business activity index from 50.2 to 51.0 points.
As a result, the U.S. dollar demonstrated a strong increase, supported by unfavorable data from the EU and the UK, as well as positive data from the United States.

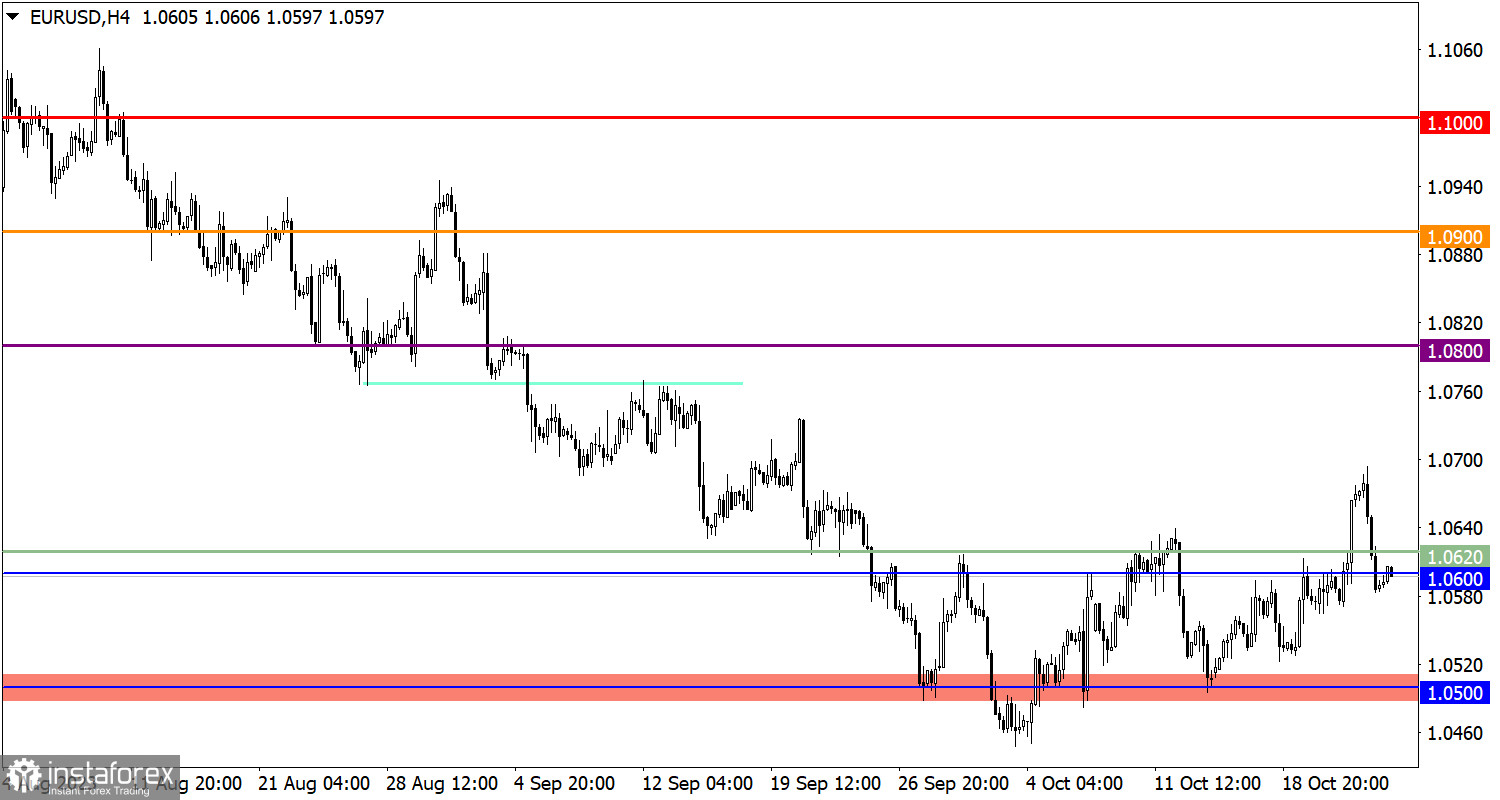
The EUR/USD currency pair not only exhibited a downward trend, but the quote also managed to drop below the 1.0600 level. This price movement resulted in a full recovery of short positions relative to the recent price surge.
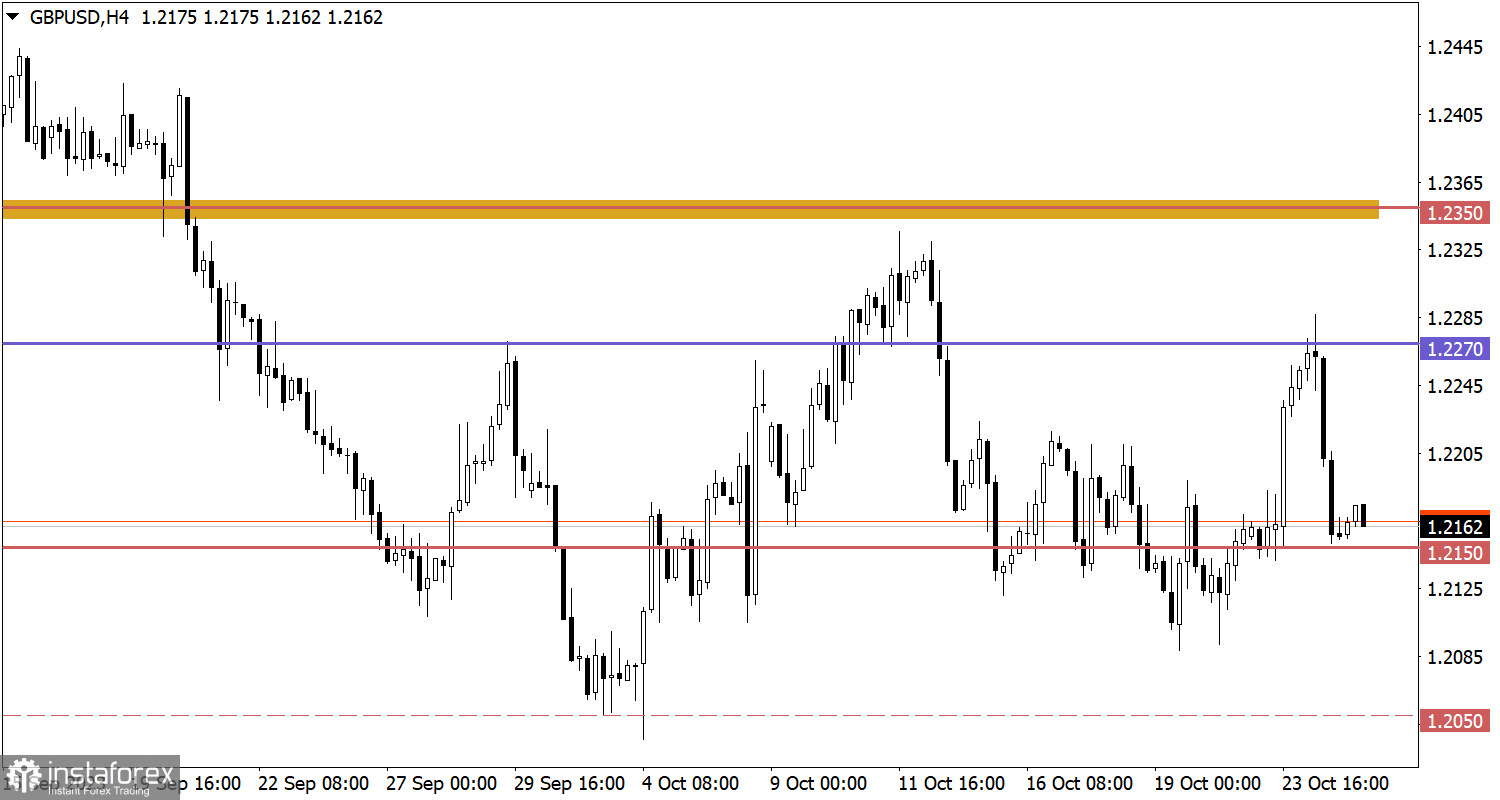
As for the GBP/USD pair, after a period of upward speculation, it shifted to a downward mode, leading to a return of the quote to the support level of 1.2150.
Today, data on the real estate market in the United States is expected to be published, where a decline in the housing market is predicted.
In this situation, the downward sentiment can still be relevant if the price remains below the 1.0600 level. In that case, there may be increased pressure on the euro, pushing it toward the 1.0500 level. However, if the volume of short positions decreases within the control range and the price rises above 1.0620, it may create a technical signal for a possible increase.
If the price holds below the support level of 1.2150, it may trigger further growth in short positions, which, in turn, will lead the price towards the upper range of the psychological level of 1.2000/1.2050. However, as long as the 1.2150 level is considered a key support, there is a possibility of a price rebound from this level.
The candlestick chart type is white and black graphic rectangles with lines above and below. With a detailed analysis of each individual candle, you can see its characteristics relative to a particular time frame: opening price, closing price, intraday high and low.
Horizontal levels are price coordinates, relative to which a price may stop or reverse its trajectory. In the market, these levels are called support and resistance.
Circles and rectangles are highlighted examples where the price reversed in history. This color highlighting indicates horizontal lines that may put pressure on the asset's price in the future.
The up/down arrows are landmarks of the possible price direction in the future.
InstaForex analytical reviews will make you fully aware of market trends! Being an InstaForex client, you are provided with a large number of free services for efficient trading.

