 Permanecer
Condições de Negociações
Ferramentas


The EUR/USD continued its upward movement on Tuesday. The growth was modest but steady, and it happens almost every day. In previous articles, we mentioned that the euro is appreciating by an average of 10 pips a day with low volatility. Therefore, although the single currency continues to rise, the scale of growth is quite small. Investors also find it difficult to trade intraday, and the euro lacks fundamental support. Lastly, the rise is part of the correction.
Yesterday, the single currency had no solid grounds to rise again. In the morning, Germany and the Eurozone released decent data on inflation and economic conditions from the ZEW institute, but the market ignored these reports. However, the US Producer Price Index (PPI) in April, which turned out to be higher than expected, put pressure on the dollar, even though it should've done the opposite. Rising producer inflation is likely to drive up consumer inflation, which reduces the chances of a Federal Reserve rate cut in 2024.
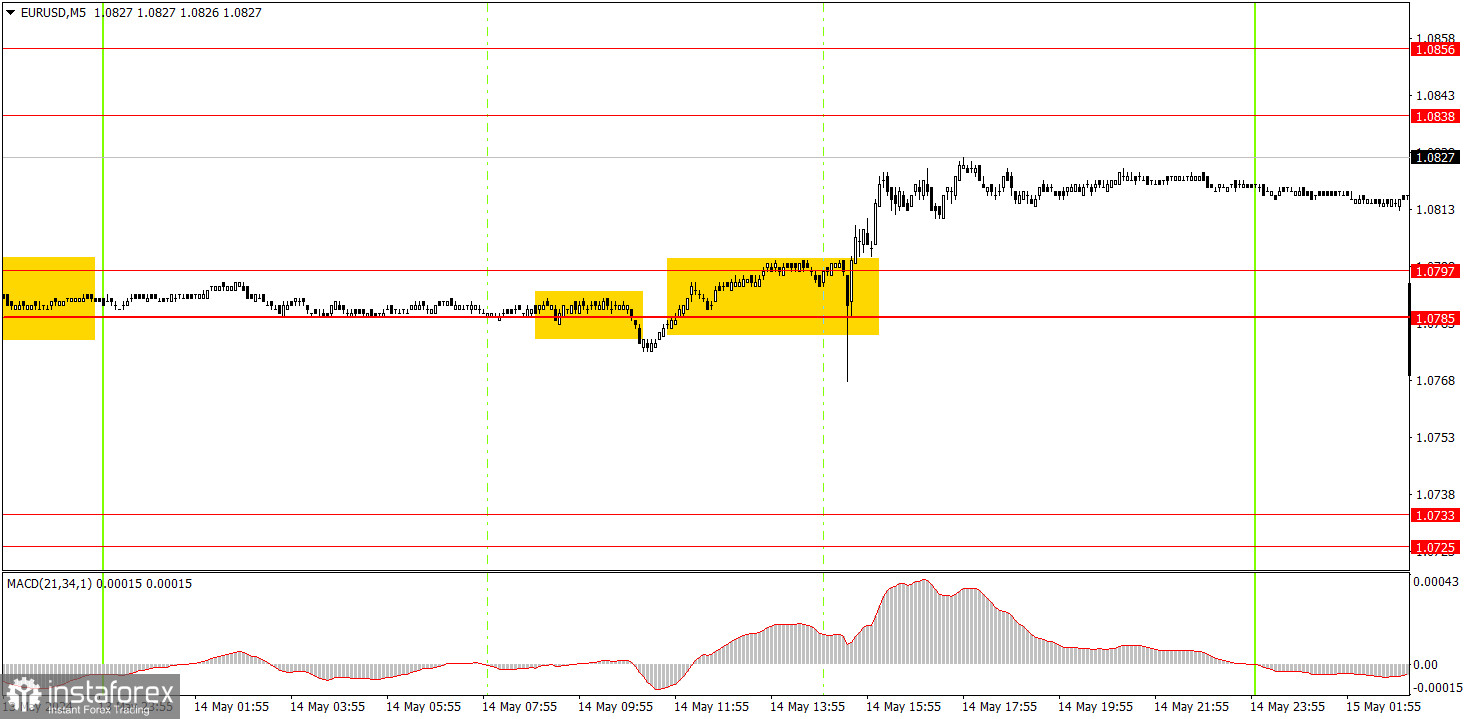
Two signals were formed on the 5-minute timeframe. First, the pair settled below the 1.0785 level, but this turned out to be a false signal. Then the pair broke through the 1.0785-1.0797 area, after which it managed to rise by about 20 pips. This likely offset the loss from the first trade, but traders could hold on to the long position until the price reached the 1.0838 level.
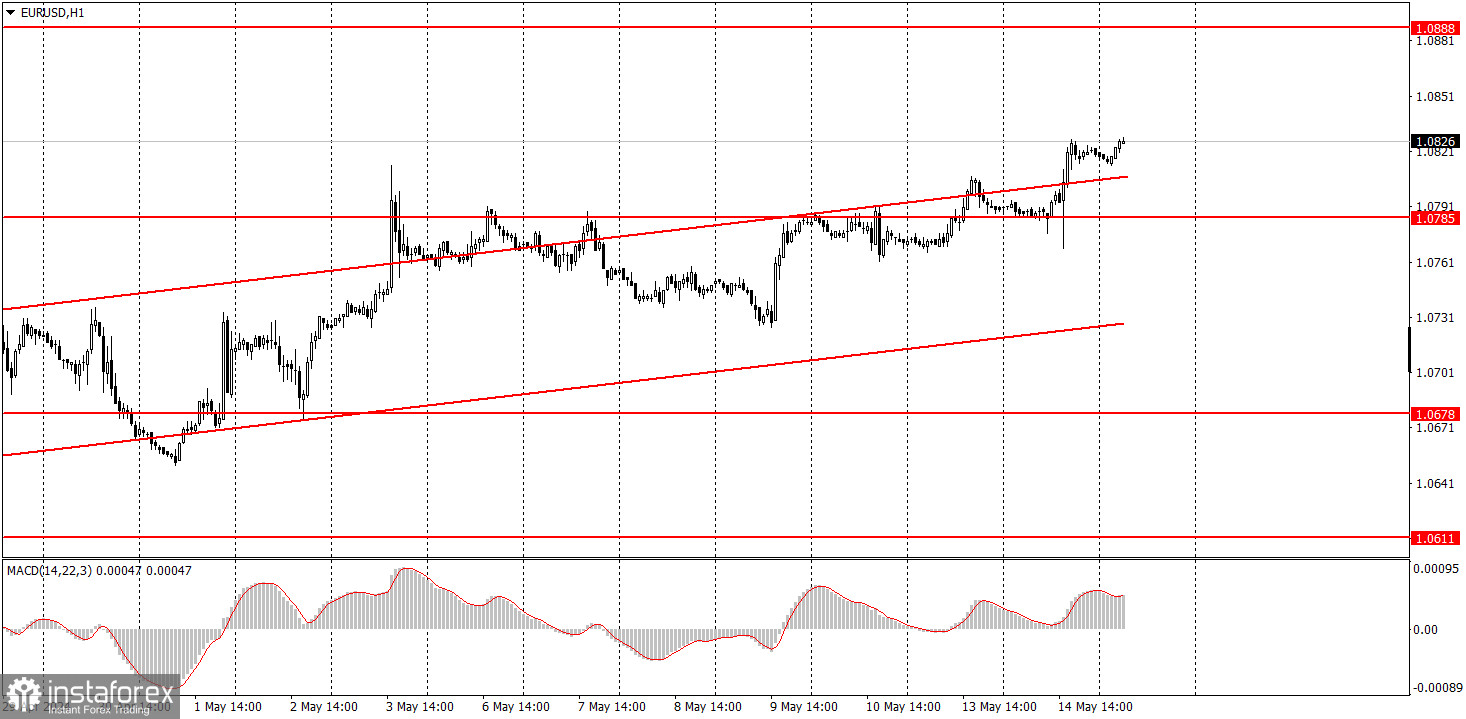
On the hourly chart, the EUR/USD pair continues to go through a corrective phase. We believe that the decline should resume in the medium term, as the euro remains expensive, and in general, the global trend is bearish. The fundamental background still supports the US dollar, and the recent FOMC meeting proved this - now Federal Reserve Chair Jerome Powell doesn't even know when monetary policy easing will begin in the US, unlike the European Central Bank.
On Wednesday, novice traders may continue to look for buy signals around the areas of 1.0785-1.0797 and 1.0838-1.0856. The rise is stable, and the market is ignoring the macroeconomic background once again.
The key levels on the 5M chart are 1.0483, 1.0526, 1.0568, 1.0611, 1.0678, 1.0725-1.0733, 1.0785-1.0797, 1.0838-1.0856, 1.0888-1.0896, 1.0940, 1.0971-1.0981. Today, the Eurozone will publish relatively important reports on GDP and industrial production. We don't expect a strong market reaction to these reports. Meanwhile, the US inflation report for April will be in focus. If inflation slows down more than forecasted, the dollar may fall further.
1) Signal strength is determined by the time taken for its formation (either a bounce or level breach). A shorter formation time indicates a stronger signal.
2) If two or more trades around a certain level are initiated based on false signals, subsequent signals from that level should be disregarded.
3) In a flat market, any currency pair can produce multiple false signals or none at all. In any case, the flat trend is not the best condition for trading.
4) Trading activities are confined between the onset of the European session and mid-way through the U.S. session, after which all open trades should be manually closed.
5) On the 30-minute timeframe, trades based on MACD signals are only advisable amidst substantial volatility and an established trend, confirmed either by a trendline or trend channel.
6) If two levels lie closely together (ranging from 5 to 15 pips apart), they should be considered as a support or resistance zone.
Support and Resistance price levels can serve as targets when buying or selling. You can place Take Profit levels near them.
Red lines represent channels or trend lines, depicting the current market trend and indicating the preferable trading direction.
The MACD(14,22,3) indicator, encompassing both the histogram and signal line, acts as an auxiliary tool and can also be used as a signal source.
Significant speeches and reports (always noted in the news calendar) can profoundly influence the price dynamics. Hence, trading during their release calls for heightened caution. It may be reasonable to exit the market to prevent abrupt price reversals against the prevailing trend.
Beginning traders should always remember that not every trade will yield profit. Establishing a clear strategy coupled with sound money management is the cornerstone of sustained trading success.
InstaForex analytical reviews will make you fully aware of market trends! Being an InstaForex client, you are provided with a large number of free services for efficient trading.


