 Permanecer
Condições de Negociações
Ferramentas


Yesterday, the EUR/USD continued its downward movement but by the end of the day it eventually remembered that it was Monday, not Friday. Thus, in less than a day, the euro lost about 170 pips, which is significant, especially considering the average volatility of recent months. We believe that such a rapid decline could and should mark the beginning of a new, prolonged downward trend. Notably, for the first time in a long while, the market ignored a negative report from the U.S. The unemployment rate rose to 4%, against a forecast of 3.9%. We view this as a positive signal for the U.S. dollar, which has been declining for a long time.
No fundamental and macroeconomic factors on Monday. Several speeches by European Central Bank representatives indicated that the central bank is not in a hurry to lower rates, with the next potential cut not expected before September. However, the euro should still fall, as the Federal Reserve is unlikely to lower rates for the first time even in September.
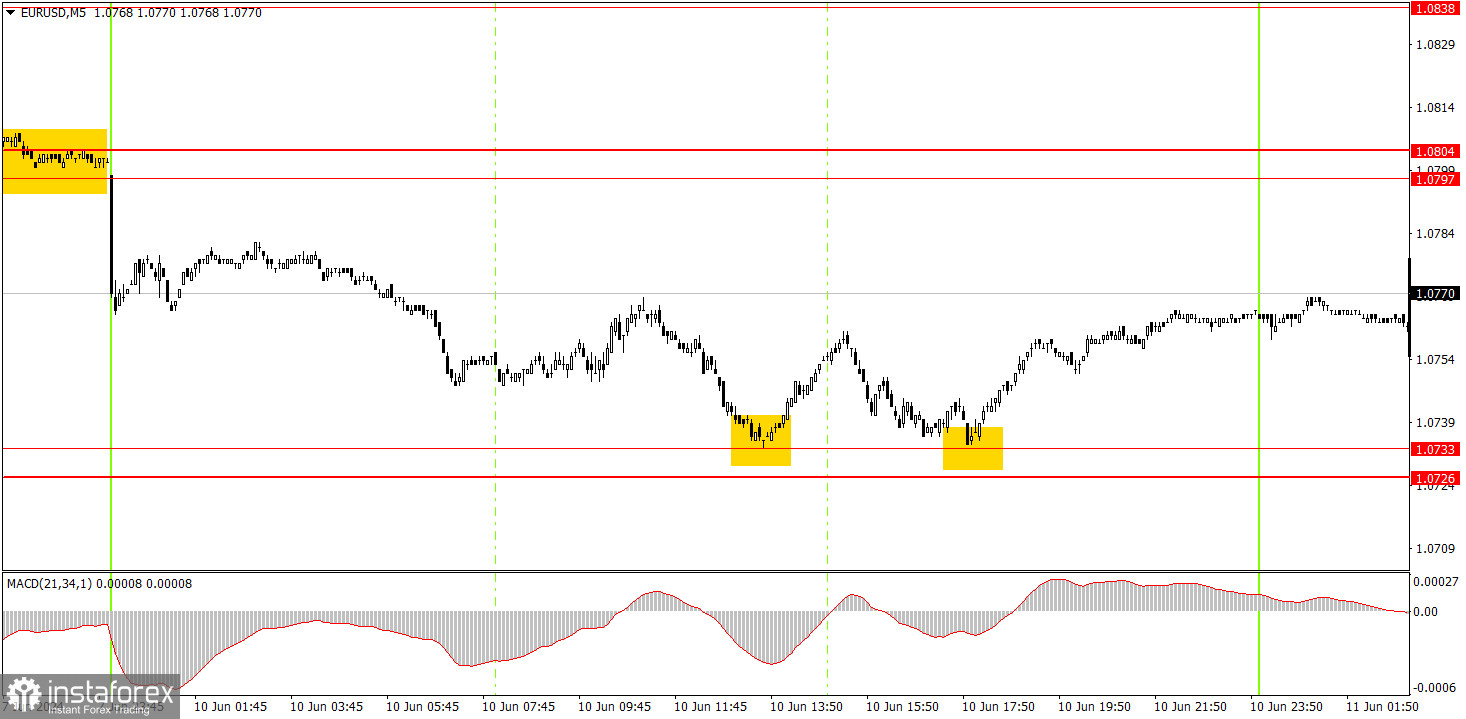
Two buy signals were formed on the 5-minute timeframe. The price bounced from the 1.0733 level twice. In both cases, it managed to rise by about 15-20 pips. Therefore, there could not have been any losses from these trades, and it was quite possible to secure small profits.
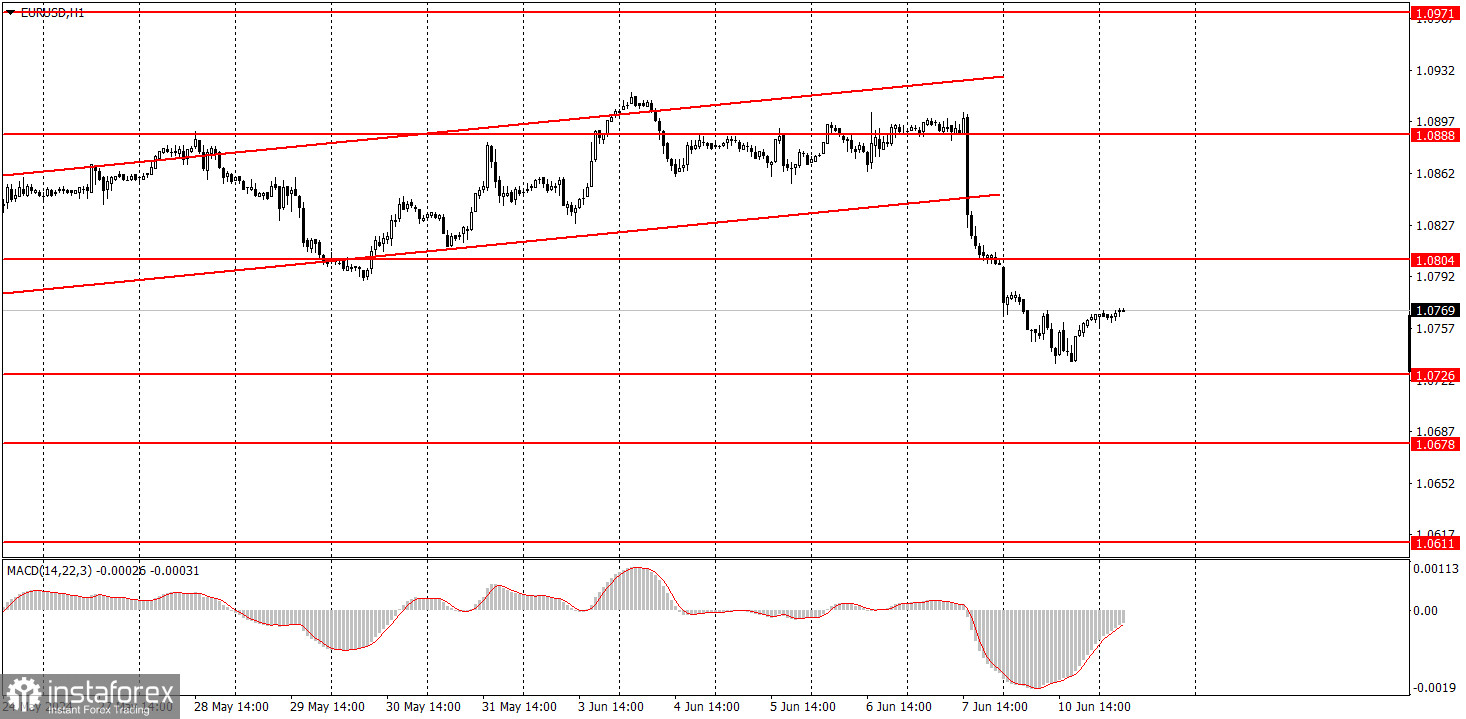
On the hourly chart, EUR/USD is in transition to form a local downtrend for the first time in a while. The price has consolidated below the ascending channel, and the market did not ignore strong U.S. data for the first time in a long period. Thus, novice traders can expect the euro to fall in the coming weeks. Moreover, the ECB has already started a cycle of monetary policy easing, which is a bearish factor for the euro. The euro is unlikely to fall rapidly, as the EUR/USD pair has never been a highly volatile instrument.
On Tuesday, traders can expect the price to return to the 1.0804 level. Yesterday, the pair bounced from the 1.0726-1.0733 area, so the pair could correct higher. Also, low volatility and a flat trend might be observed today due to the absence of news.
The key levels on the 5M chart are 1.0483, 1.0526, 1.0568, 1.0611, 1.0678, 1.0726-1.0733, 1.0797-1.0804, 1.0838-1.0856, 1.0888-1.0896, 1.0940, and 1.0971-1.0981. No significant or interesting events scheduled in the U.S. or the Eurozone for today.
1) Signal strength is determined by the time taken for its formation (either a bounce or level breach). A shorter formation time indicates a stronger signal.
2) If two or more trades around a certain level are initiated based on false signals, subsequent signals from that level should be disregarded.
3) In a flat market, any currency pair can produce multiple false signals or none at all. In any case, the flat trend is not the best condition for trading.
4) Trading activities are confined between the onset of the European session and mid-way through the U.S. session, after which all open trades should be manually closed.
5) On the 30-minute timeframe, trades based on MACD signals are only advisable amidst substantial volatility and an established trend, confirmed either by a trendline or trend channel.
6) If two levels lie closely together (ranging from 5 to 15 pips apart), they should be considered as a support or resistance zone.
Support and Resistance price levels can serve as targets when buying or selling. You can place Take Profit levels near them.
Red lines represent channels or trend lines, depicting the current market trend and indicating the preferable trading direction.
The MACD(14,22,3) indicator, encompassing both the histogram and signal line, acts as an auxiliary tool and can also be used as a signal source.
Significant speeches and reports (always noted in the news calendar) can profoundly influence the price dynamics. Hence, trading during their release calls for heightened caution. It may be reasonable to exit the market to prevent abrupt price reversals against the prevailing trend.
Beginners should always remember that not every trade will yield profit. Establishing a clear strategy coupled with sound money management is the cornerstone of sustained trading success.
InstaForex analytical reviews will make you fully aware of market trends! Being an InstaForex client, you are provided with a large number of free services for efficient trading.

