 Permanecer
Condições de Negociações
Ferramentas


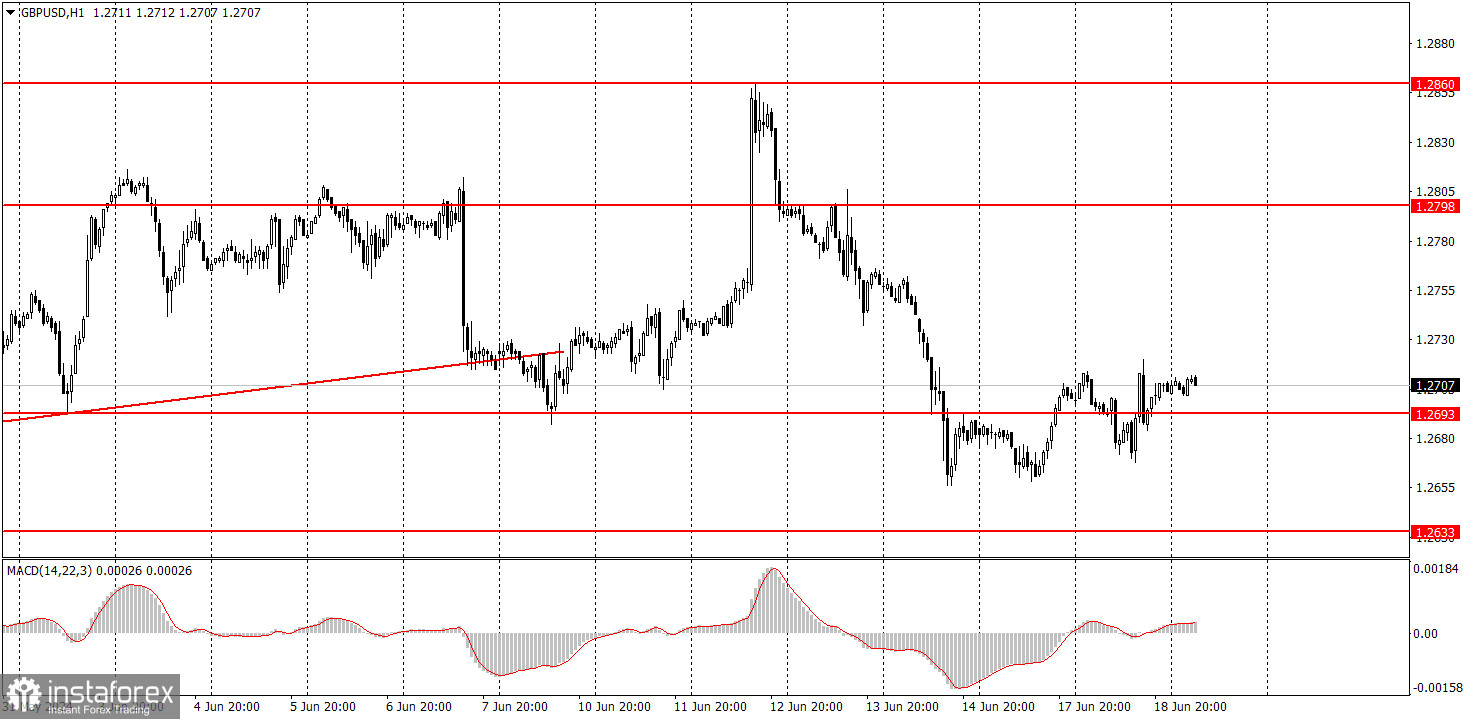
GBP/USD also continued its bullish correction on Tuesday. Currently, the difference between the euro and the pound lies in the fact that while the euro is showing a clear downward trend both globally and locally, the pound is exhibiting an erratic flat pattern. If we look into the 4-hour or daily charts, its clear that the pair has predominantly moved sideways over the past 3-4 weeks. Therefore, the pound may correct higher, especially since the pair experienced a significant decline last week. However, it's important to understand that this decline is just one episode within a broader flat.
The British pound continues to disappoint traders with its movements. There has been no trend for quite some time now, making it extremely difficult to determine the pair's direction and movement even on the daily chart. Last week, the price seemingly broke below the key level of 1.2693, but this week we have not seen any continuation of the downward movement. The inflation report will be published in just a few hours, which could provide some clarity on the prospects for the British currency.
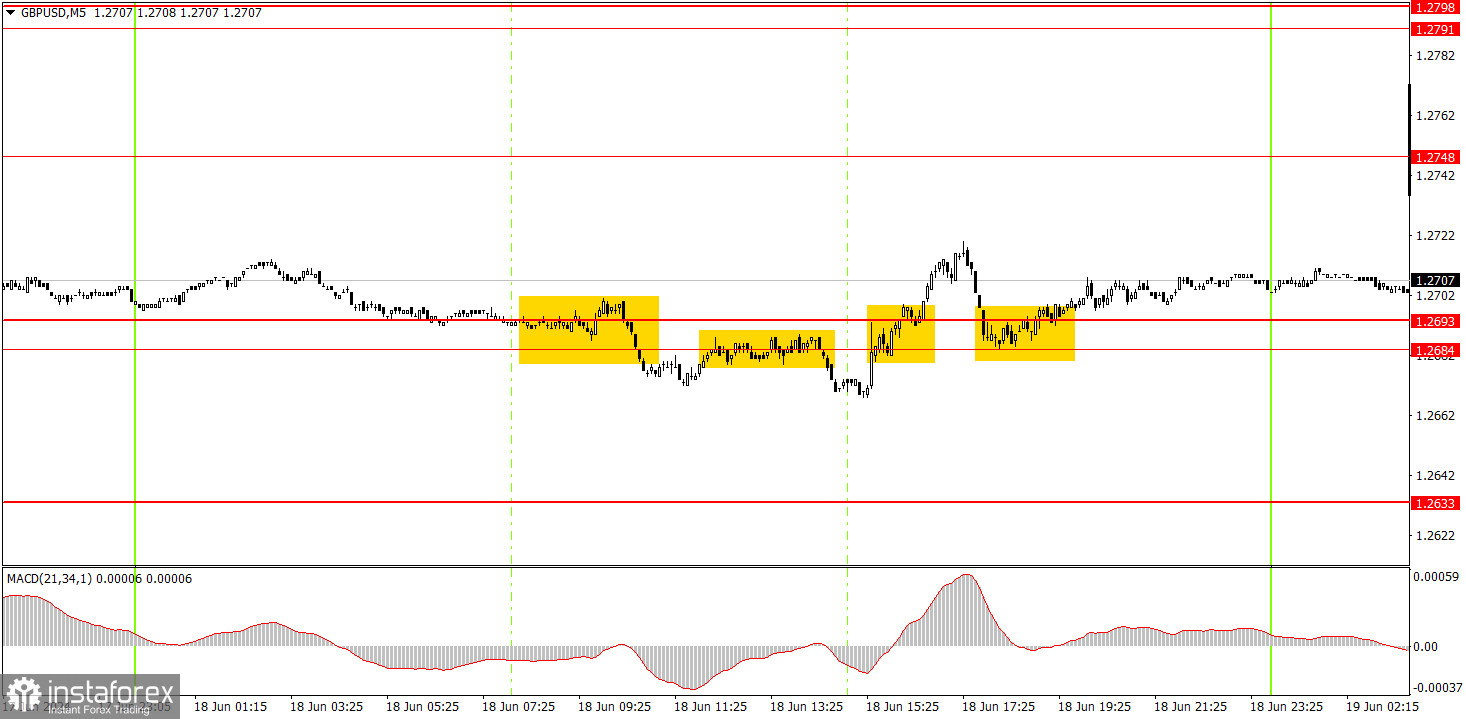
Two duplicate sell signals and two duplicate buy signals were formed on the 5-minute chart. In both cases, the pair's movement in the intended direction did not exceed 15 pips, and overall, volatility was quite small. Therefore, it was unlikely for traders to make profit from these signals. However, we can't blame the signals themselves, in fact it has something to do with the pair's low volatility. When the price remains stagnant, it's extremely challenging to capitalize on such movements.
On the hourly chart, the GBP/USD pair has good prospects for forming a downward trend, although the uptrend still persists along with a monthly flat pattern. It is a good thing that the price managed to break below the level of 1.2693 on Friday; however, the pound climbed above this level once again. The market is hesitant to sell the pound, even if there are technical, fundamental, and macroeconomic reasons to do so.
On Wednesday, we would advise you to closely monitor the area of 1.2684-1.2693. Long positions are valid for now, but if the price settles below this area once again, it might be worth trying to sell the British pound.
The key levels on the 5M chart are 1.2457, 1.2502, 1.2541-1.2547, 1.2605-1.2633, 1.2684-1.2693, 1.2748, 1.2791-1.2798, 1.2848-1.2860, 1.2913, 1.2980. Today, the main event of the day is the UK inflation report. It will show whether the market is poised for a logical response or if we will continue to see investors buying the British currency regardless of circumstances.
1) Signal strength is determined by the time taken for its formation (either a bounce or level breach). A shorter formation time indicates a stronger signal.
2) If two or more trades around a certain level are initiated based on false signals, subsequent signals from that level should be disregarded.
3) In a flat market, any currency pair can produce multiple false signals or none at all. In any case, the flat trend is not the best condition for trading.
4) Trading activities are confined between the onset of the European session and mid-way through the U.S. session, after which all open trades should be manually closed.
5) On the 30-minute timeframe, trades based on MACD signals are only advisable amidst substantial volatility and an established trend, confirmed either by a trendline or trend channel.
6) If two levels lie closely together (ranging from 5 to 15 pips apart), they should be considered as a support or resistance zone.
Support and Resistance price levels can serve as targets when buying or selling. You can place Take Profit levels near them.
Red lines represent channels or trend lines, depicting the current market trend and indicating the preferable trading direction.
The MACD(14,22,3) indicator, encompassing both the histogram and signal line, acts as an auxiliary tool and can also be used as a signal source.
Significant speeches and reports (always noted in the news calendar) can profoundly influence the price dynamics. Hence, trading during their release calls for heightened caution. It may be reasonable to exit the market to prevent abrupt price reversals against the prevailing trend.
Beginners should always remember that not every trade will yield profit. Establishing a clear strategy coupled with sound money management is the cornerstone of sustained trading success.
InstaForex analytical reviews will make you fully aware of market trends! Being an InstaForex client, you are provided with a large number of free services for efficient trading.

