 Permanecer
Condições de Negociações
Ferramentas


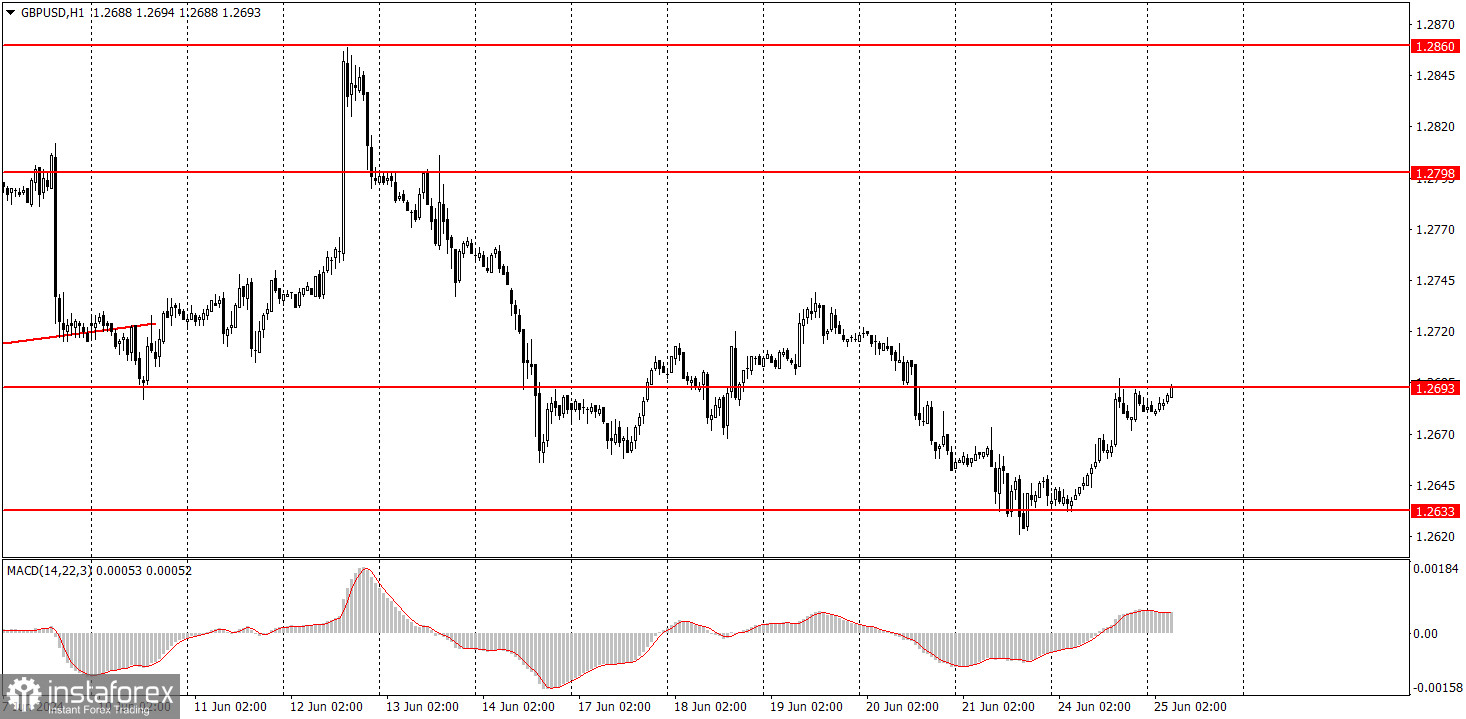
GBP/USD bounced off the 1.2633 level once again and started a new upward correction within a presumably emerging downtrend. Since there were no significant news events on Monday and none are expected throughout the week, the pair may show erratic movements and continue to go through a correction. However, yesterday, the pair managed to rise by 60 pips. A bounce from the 1.2693 level may trigger a move in the opposite direction.
Overall, it's worth noting that the pound sterling is reluctant to fall. Essentially, it has not moved very far from its recent high. Last week's fundamental and macroeconomic backdrop was quite significant. Regardless of how the market interprets this, it is clear that the Bank of England might lower the key rate in August, and the next inflation report might show a slowdown below the target level of 2%. These are strong bearish factors for the British currency, and the pound could have even shown a decline on Monday as it remains extremely overbought.
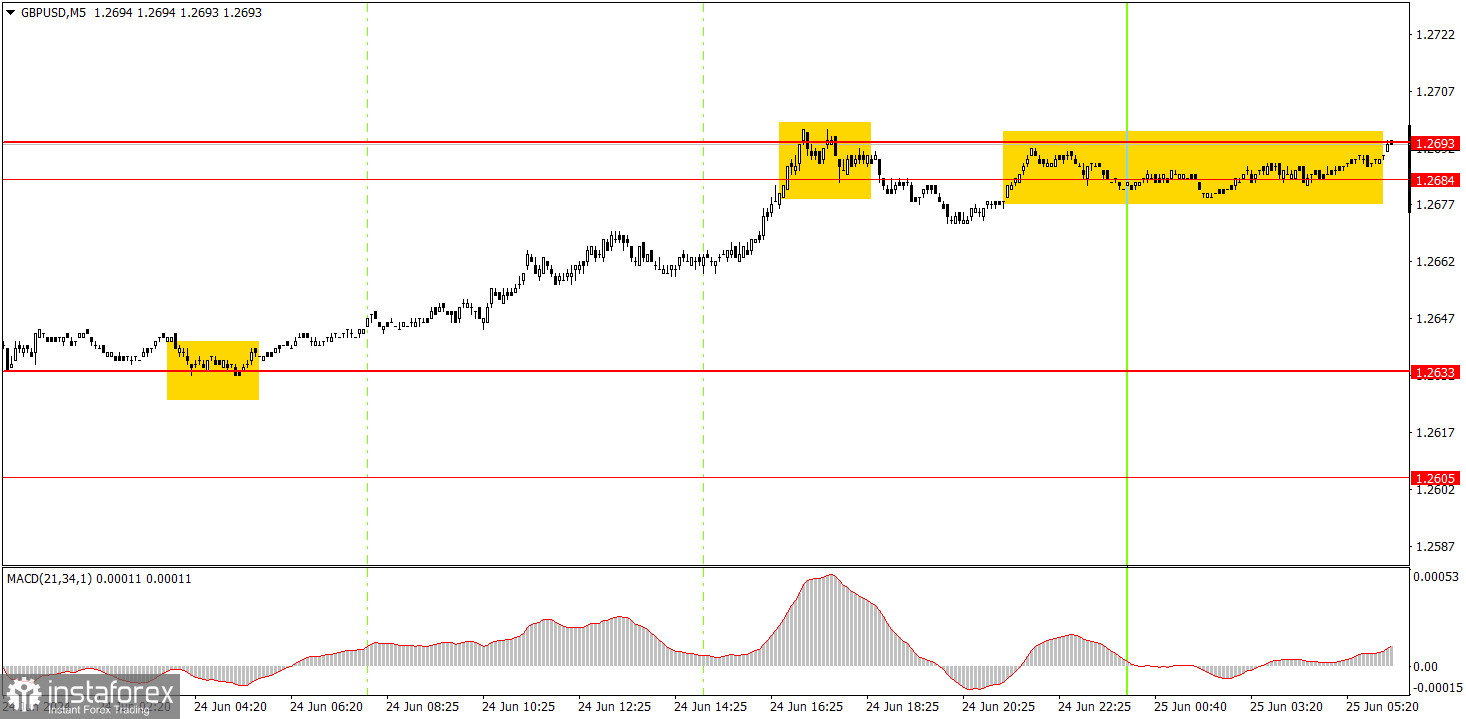
On the 5-minute timeframe, the pair formed a perfect buy signal around the 1.2633 level. During the US trading session, the price reached the 1.2684-1.2693 area, where traders could take profits. As a result, the price returned to this area and it will likely break through one of the sides, which will indicate the pair's further direction.
On the hourly chart, the GBP/USD pair continues to show promising signs of forming a downtrend, although the uptrend has not been invalidated. In regards to the pair's bearish prospects, it's a good thing that the price managed to overcome the 1.2693 level twice; However, the market often refuses to sell, even in the presence of technical, fundamental, and macroeconomic factors favoring such a direction.
On Tuesday, the British pound may continue to exhibit erratic and illogical movements. For instance, it might go back to the 1.2633 level. However, if it breaks through the 1.2684-1.2693 area, the upward movement may also continue.
The key levels on the 5M chart are 1.2457, 1.2502, 1.2541-1.2547, 1.2605-1.2633, 1.2684-1.2693, 1.2748, 1.2791-1.2798, 1.2848-1.2860, 1.2913, 1.2980. Today, the economic calendars of the US and the UK are relatively light. Therefore, traders will likely face another boring day.
1) Signal strength is determined by the time taken for its formation (either a bounce or level breach). A shorter formation time indicates a stronger signal.
2) If two or more trades around a certain level are initiated based on false signals, subsequent signals from that level should be disregarded.
3) In a flat market, any currency pair can produce multiple false signals or none at all. In any case, the flat trend is not the best condition for trading.
4) Trading activities are confined between the onset of the European session and mid-way through the U.S. session, after which all open trades should be manually closed.
5) On the 30-minute timeframe, trades based on MACD signals are only advisable amidst substantial volatility and an established trend, confirmed either by a trendline or trend channel.
6) If two levels lie closely together (ranging from 5 to 15 pips apart), they should be considered as a support or resistance zone.
Support and Resistance price levels can serve as targets when buying or selling. You can place Take Profit levels near them.
Red lines represent channels or trend lines, depicting the current market trend and indicating the preferable trading direction.
The MACD(14,22,3) indicator, encompassing both the histogram and signal line, acts as an auxiliary tool and can also be used as a signal source.
Significant speeches and reports (always noted in the news calendar) can profoundly influence the price dynamics. Hence, trading during their release calls for heightened caution. It may be reasonable to exit the market to prevent abrupt price reversals against the prevailing trend.
Beginners should always remember that not every trade will yield profit. Establishing a clear strategy coupled with sound money management is the cornerstone of sustained trading success.
InstaForex analytical reviews will make you fully aware of market trends! Being an InstaForex client, you are provided with a large number of free services for efficient trading.


