 Permanecer
Condições de Negociações
Ferramentas


GBP/USD also experienced low volatility and the pair hardly moved on Friday. Despite the fact that Friday saw the release of practically the only report in the UK for the week, as well as some US reports, the market chose to ignore these information. The UK economy grew stronger than expected in the first quarter, but this report had no impact on the pair's movements. In the US, relatively important PCE indices and data on consumer sentiment were released, which provided some support for the dollar in the second half of the day. But are we really interested in such a market reaction when the pair's volatility for the entire day was just 45 pips? The pair's value remained flat.
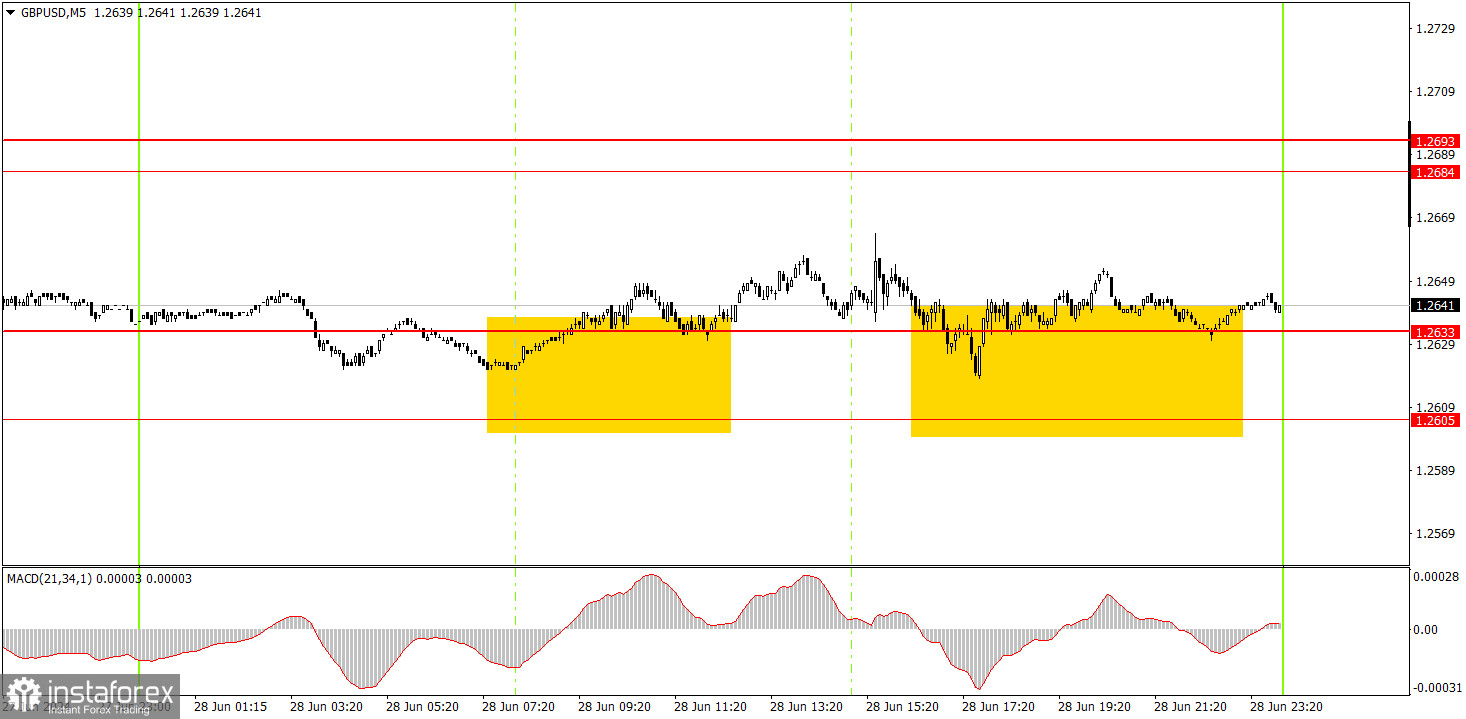
The pair formally generated one buy signal on the 5-minute timeframe. During the European trading session, the pair spent several hours struggling to bounce off the area of 1.2605-1.2633. This signal was so weak and inaccurate that there was no point in executing it. In any case, before the release of US data, traders could have expected the pair to change its direction.
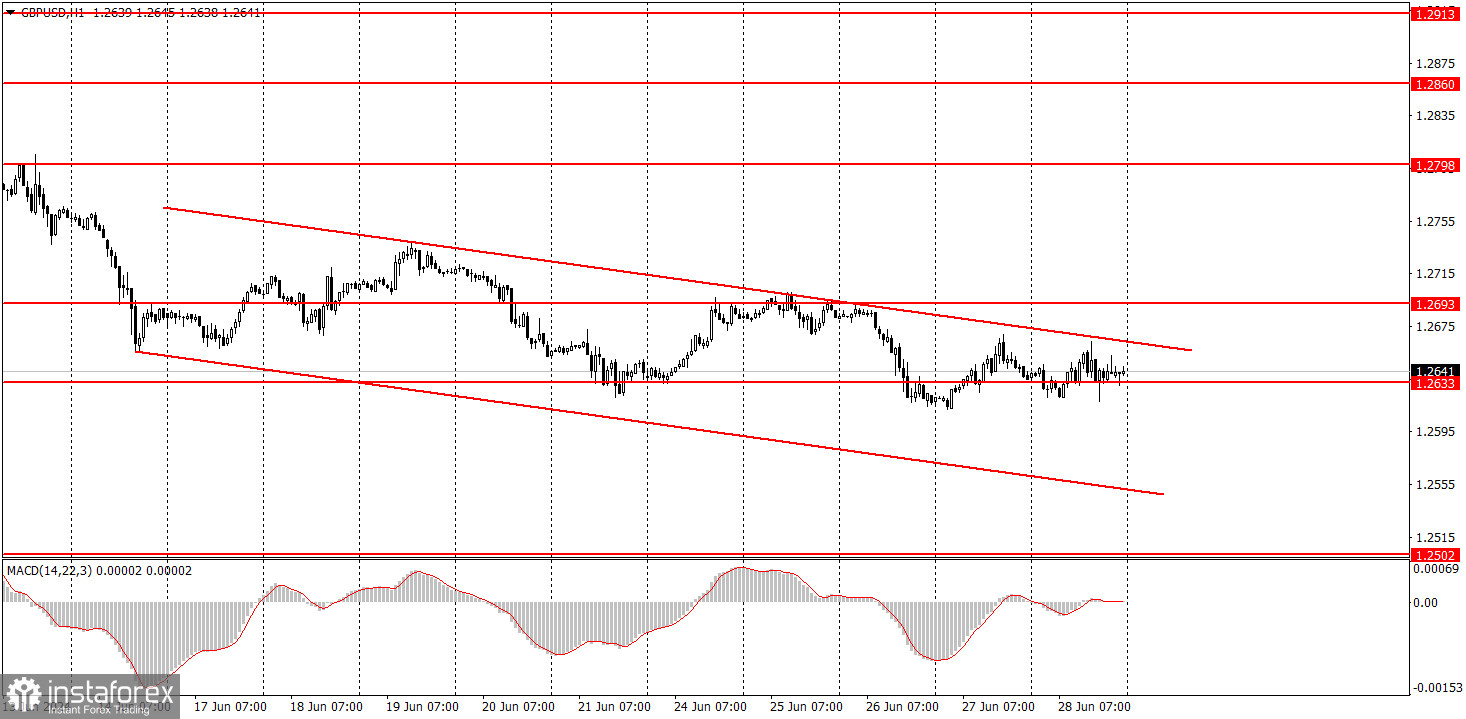
On the hourly chart, GBP/USD continues to show promising signs of forming a downtrend, but this doesn't mean that the pair can't form an upward trend. In regards to the bearish prospects, it's a good thing that the price managed to overcome the 1.2693 level twice; However, the market often refuses to sell, even in the presence of technical, fundamental, and macroeconomic factors favoring such a direction. Even now, it is clear that each new low is only slightly lower than the previous one, and corrections are quite frequent. This indicates the weakness of the downward trend.
On Monday, the British pound may continue to exhibit erratic and illogical movements. Fortunately, the pair may begin to show stronger movements as the upcoming week includes a significant amount of important data.
The key levels on the 5M chart are 1.2457, 1.2502, 1.2541-1.2547, 1.2605-1.2633, 1.2684-1.2693, 1.2748, 1.2791-1.2798, 1.2848-1.2860, 1.2913, 1.2980. On Monday, the UK will release the Manufacturing PMI for June, and similar indices will be published in the US as well, including the important ISM data.
1) Signal strength is determined by the time taken for its formation (either a bounce or level breach). A shorter formation time indicates a stronger signal.
2) If two or more trades around a certain level are initiated based on false signals, subsequent signals from that level should be disregarded.
3) In a flat market, any currency pair can produce multiple false signals or none at all. In any case, the flat trend is not the best condition for trading.
4) Trading activities are confined between the onset of the European session and mid-way through the U.S. session, after which all open trades should be manually closed.
5) On the 30-minute timeframe, trades based on MACD signals are only advisable amidst substantial volatility and an established trend, confirmed either by a trendline or trend channel.
6) If two levels lie closely together (ranging from 5 to 15 pips apart), they should be considered as a support or resistance zone.
Support and Resistance price levels can serve as targets when buying or selling. You can place Take Profit levels near them.
Red lines represent channels or trend lines, depicting the current market trend and indicating the preferable trading direction.
The MACD(14,22,3) indicator, encompassing both the histogram and signal line, acts as an auxiliary tool and can also be used as a signal source.
Significant speeches and reports (always noted in the news calendar) can profoundly influence the price dynamics. Hence, trading during their release calls for heightened caution. It may be reasonable to exit the market to prevent abrupt price reversals against the prevailing trend.
Beginners should always remember that not every trade will yield profit. Establishing a clear strategy coupled with sound money management is the cornerstone of sustained trading success.
InstaForex analytical reviews will make you fully aware of market trends! Being an InstaForex client, you are provided with a large number of free services for efficient trading.

