 Permanecer
Condições de Negociações
Ferramentas


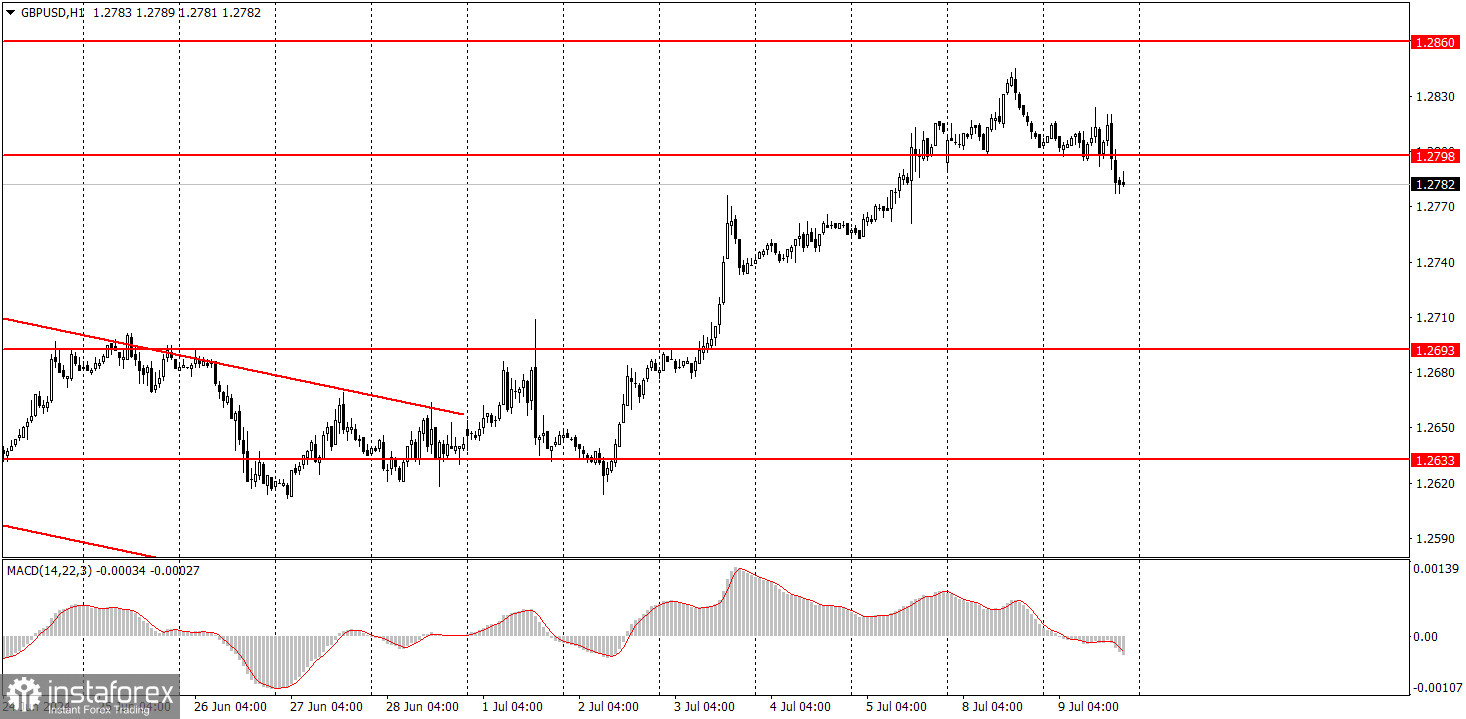
GBP/USD did fall on Tuesday, which is a notable difference from the EUR/USD pair. If you look closely, a "head and shoulders'' pattern formed on the hourly timeframe, and breaking through the 1.2798 level served as a confirmation. Just overcoming the 1.2798 level made it possible for traders to open short positions and expect the British pound to fall.
It is important to mention that the pound is extremely overbought, and if we consider the last 7-9 months and not just the past week, then it's obvious that the British currency is tremendously high for the fundamental and macroeconomic background that was present during this period. Therefore, we support the British currency's decline. Unfortunately, this week the market will have to familiarize itself with the US inflation report, and we know that the market uses any formal reason to get rid of the dollar and buy the pound. Of course, this won't last forever, but it's hard to say whether the pair will stop showing illogical movements.
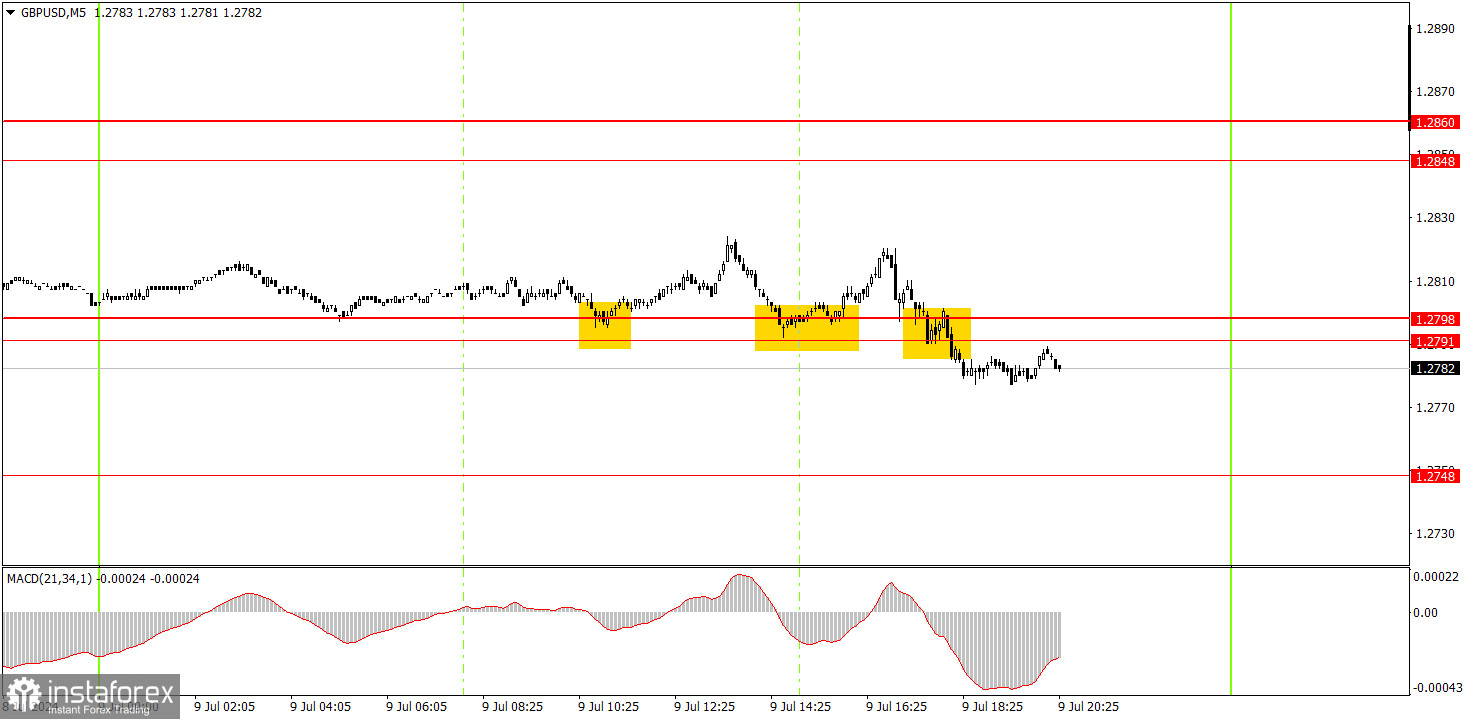
On the 5-minute timeframe, the price bounced off the 1.2791-1.2798 area twice, and then broke through it. Beginners could have opened one long position and one short position. The two buy signals duplicated each other. Traders could hold onto the short position at least until the US inflation data is released on Thursday. The volatility on Tuesday was 46 pips, and with such volatility, it could take two days for the price to crawl to the 1.2748 level.
On the hourly chart, GBP/USD continues to show promising signs of forming a downtrend, but this doesn't mean that the pair can't form an upward trend. The pair has been rising again, and overall, it continues to exhibit erratic and illogical movements. Currently, the pound sterling has returned to its recent local high and continues to ignore the fundamental background.
On Wednesday, the pound sterling may gradually fall, as suggested by technical factors. We can expect a new round of the bearish correction with a target at 1.2748.
The key levels on the 5M chart are 1.2457, 1.2502, 1.2541-1.2547, 1.2605-1.2633, 1.2684-1.2693, 1.2748, 1.2791-1.2798, 1.2848-1.2860, 1.2913, and 1.2980. Today, there are no important events scheduled in the UK, but Federal Reserve Chief Jerome Powell will give his second speech in Congress. Yesterday, Powell gave little away, and he is unlikely to report anything important today either.
1) Signal strength is determined by the time taken for its formation (either a bounce or level breach). A shorter formation time indicates a stronger signal.
2) If two or more trades around a certain level are initiated based on false signals, subsequent signals from that level should be disregarded.
3) In a flat market, any currency pair can produce multiple false signals or none at all. In any case, the flat trend is not the best condition for trading.
4) Trading activities are confined between the onset of the European session and mid-way through the U.S. session, after which all open trades should be manually closed.
5) On the 30-minute timeframe, trades based on MACD signals are only advisable amidst substantial volatility and an established trend, confirmed either by a trendline or trend channel.
6) If two levels lie closely together (ranging from 5 to 15 pips apart), they should be considered as a support or resistance zone.
Support and Resistance price levels can serve as targets when buying or selling. You can place Take Profit levels near them.
Red lines represent channels or trend lines, depicting the current market trend and indicating the preferable trading direction.
The MACD(14,22,3) indicator, encompassing both the histogram and signal line, acts as an auxiliary tool and can also be used as a signal source.
Significant speeches and reports (always noted in the news calendar) can profoundly influence the price dynamics. Hence, trading during their release calls for heightened caution. It may be reasonable to exit the market to prevent abrupt price reversals against the prevailing trend.
Beginners should always remember that not every trade will yield profit. Establishing a clear strategy coupled with sound money management is the cornerstone of sustained trading success.
InstaForex analytical reviews will make you fully aware of market trends! Being an InstaForex client, you are provided with a large number of free services for efficient trading.


