 Permanecer
Condições de Negociações
Ferramentas


EUR/USD showed more volatile movements on Thursday, although this wasn't surprising. We already mentioned that the U.S. inflation report would be the key event of the week. Furthermore, we also said that the dollar may fall if inflation decreases within the forecast range. In the end, both core and headline inflation fell more than expected, and the dollar nearly collapsed.
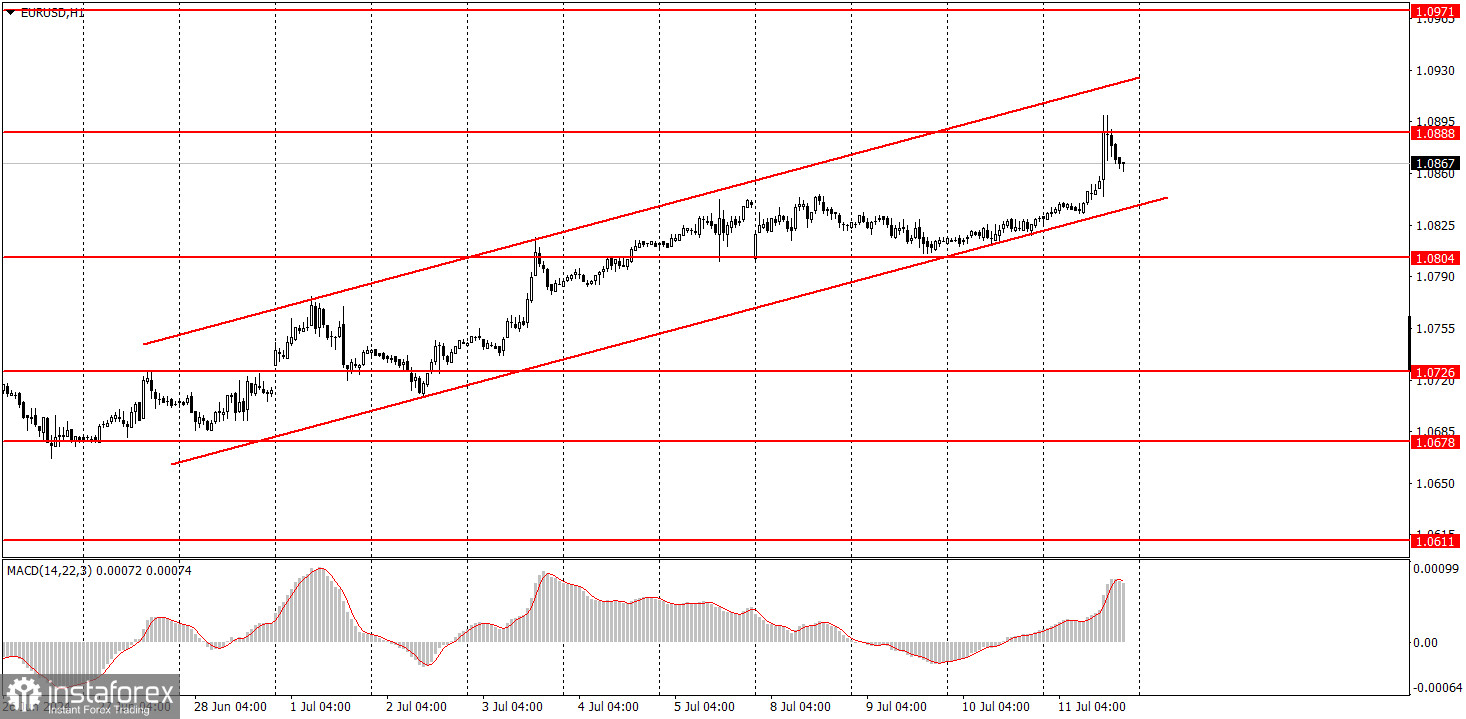
It may seem that it was logical for the dollar to fall, and for the past two weeks, it has been. However, there's one caveat. The market continues to ignore the fact that the European Central Bank has started to lower borrowing costs, while there is no guarantee that the Federal Reserve will start cutting rates in September. Inflation in the U.S. has decreased to 3%, but it should be pointed out that this is not enough to start lowering the rate. Therefore, the euro's growth can be considered logical, but with a caveat. Technically, there is an ascending channel, so until the price consolidates below it, it would be pointless to expect a downward movement from the pair.
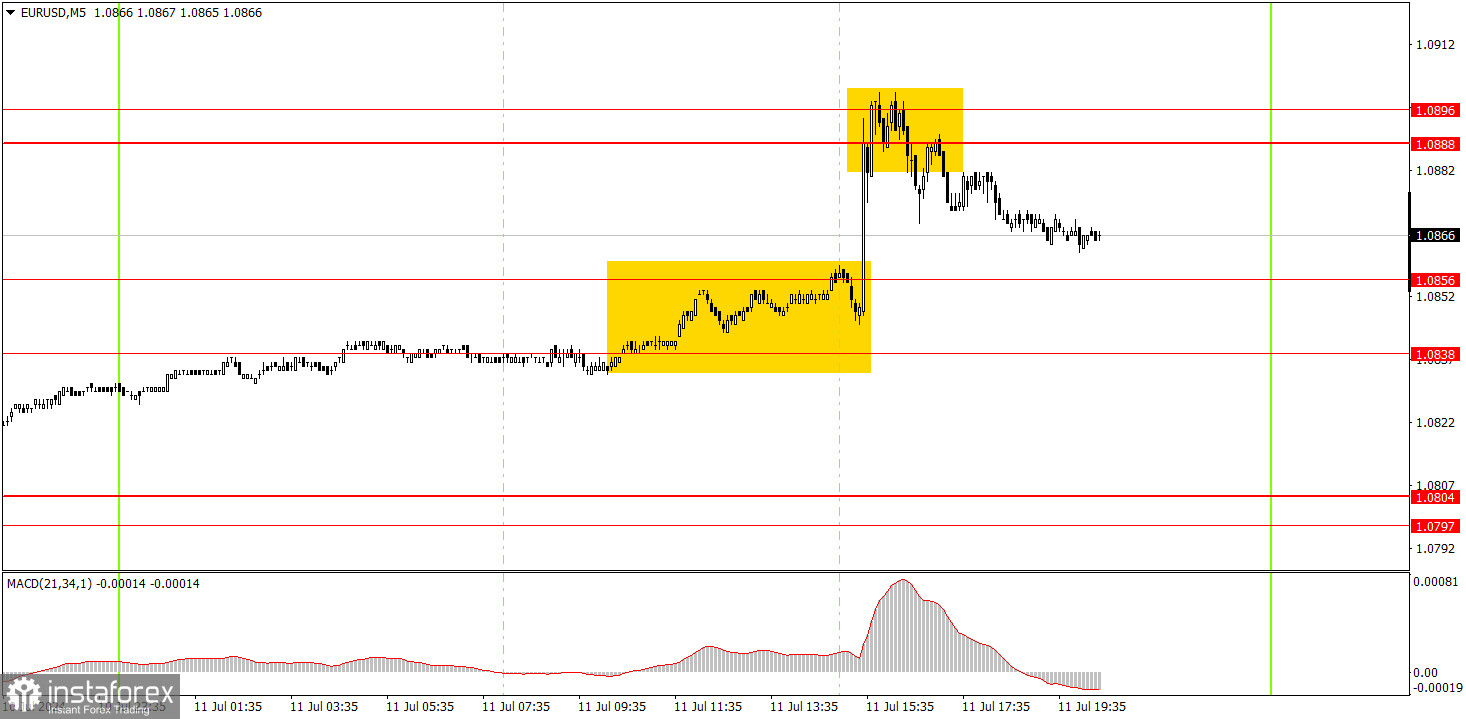
Two trading signals were formed on the 5-minute timeframe. The first buy signal was generated right when the U.S. inflation data was released, and it was impossible to act on it. The second signal, in the form of a rebound from the 1.0888-1.0896 area, was more gradual, and novice traders could open short positions based on it. By the end of the day, the pair might reach the 1.0856 level, where traders could lock in profit. It's rare to see such movements these days.
On the hourly chart, EUR/USD is unable to break through the 1.0678 level, and last week's economic reports had a devastating effect on the dollar. Therefore, it was logical for the euro to rise. Despite this movement, the overall (downward) trend has not changed, but the euro has been frequently trading with strong corrections over the past 7-8 months. Formally, the euro is in a downward trend, as seen on the higher time frames, but the process of the pair's decline in the medium-term has been extremely slow.
On Friday, beginners can trade from the 1.0838-1.0856 area. A rebound from this area could provoke the pair's growth, but today there will be very few significant events, so volatility may return to extremely-low levels.
The key levels on the 5M chart are 1.0483, 1.0526, 1.0568, 1.0611, 1.0678, 1.0726-1.0733, 1.0797-1.0804, 1.0838-1.0856, 1.0888-1.0896, 1.0940, 1.0971-1.0981. For Friday, no significant events are scheduled in the Eurozone, while the US will publish reports of moderate importance – the University of Michigan consumer sentiment index and the Producer Price Index. Traders may become more active during the U.S. session..
1) Signal strength is determined by the time taken for its formation (either a bounce or level breach). A shorter formation time indicates a stronger signal.
2) If two or more trades around a certain level are initiated based on false signals, subsequent signals from that level should be disregarded.
3) In a flat market, any currency pair can produce multiple false signals or none at all. In any case, the flat trend is not the best condition for trading.
4) Trading activities are confined between the onset of the European session and mid-way through the U.S. session, after which all open trades should be manually closed.
5) On the 30-minute timeframe, trades based on MACD signals are only advisable amidst substantial volatility and an established trend, confirmed either by a trendline or trend channel.
6) If two levels lie closely together (ranging from 5 to 15 pips apart), they should be considered as a support or resistance zone.
Support and Resistance price levels can serve as targets when buying or selling. You can place Take Profit levels near them.
Red lines represent channels or trend lines, depicting the current market trend and indicating the preferable trading direction.
The MACD(14,22,3) indicator, encompassing both the histogram and signal line, acts as an auxiliary tool and can also be used as a signal source.
Significant speeches and reports (always noted in the news calendar) can profoundly influence the price dynamics. Hence, trading during their release calls for heightened caution. It may be reasonable to exit the market to prevent abrupt price reversals against the prevailing trend.
Beginners should always remember that not every trade will yield profit. Establishing a clear strategy coupled with sound money management is the cornerstone of sustained trading success.
InstaForex analytical reviews will make you fully aware of market trends! Being an InstaForex client, you are provided with a large number of free services for efficient trading.


