 Permanecer
Condições de Negociações
Ferramentas


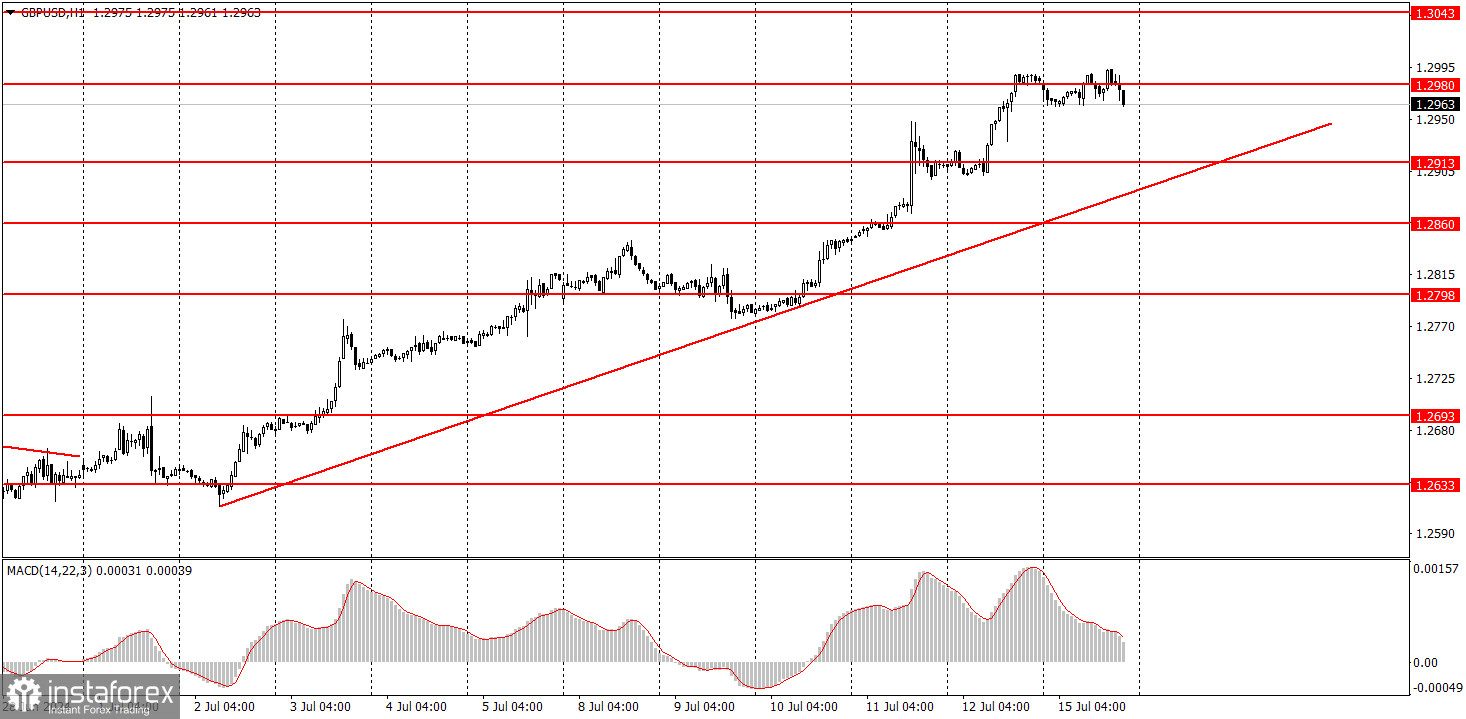
GBP/USD resumed its positive trading on Monday. Although the pound failed to rise at the end of the day, the pair did not even pull back. In the first half of the day, the pound was still trying to move down a bit, but where should it go if the market continues to buy it? The market had no reason to buy the pair on Monday. However, the market has not needed reasons and grounds for a very long time. The pound sterling has been rising for several days, ignoring the fact that the Bank of England may lower the rate on August 1, and inflation in the UK has dropped to the central bank's target level.
But none of this matters to the market. The local upward trend continues, as evidenced by the rising trend line. The second point at which it was formed is simply a point in the flat, and not an extreme. If the pound is bought even without reason or justification, it can rise for as long as it wants.
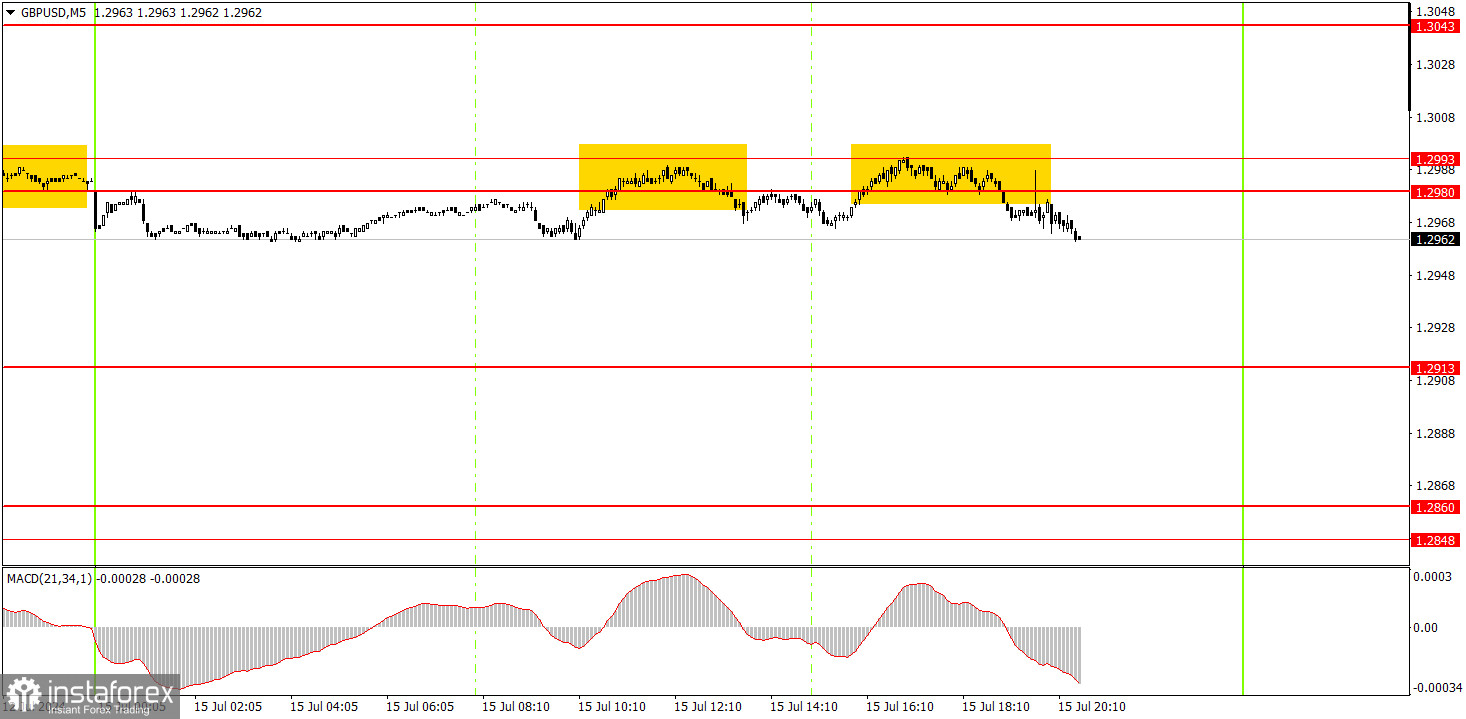
On the 5-minute timeframe, the price returned to the area of 1.2980-1.2993. It couldn't overcome this mark, but what difference does it make when the next important level or area is overcome? The market is not considering these resistances even for corrections or rollbacks. Therefore, there's a good chance that the pound may continue to rise once it overcomes this area.
On the hourly chart, GBP/USD continues to show promising signs of forming a downtrend, but this doesn't mean that the pair can't form an upward trend. The pair has been rising again, and overall, it continues to exhibit erratic and illogical movements. Currently, the pound sterling has surpassed its latest local high and continues to ignore the fundamental backdrop. However, no one can deny that currently the economic reports have been supporting the pound.
On Tuesday, the pound sterling may start to gradually fall towards the level of 1.2913 if it fails to overcome 1.2980-1.2993. However, we don't expect a sharp decline unless the pound breaches the trend line. And even if it does, it might not happen altogether. This has been the case at least five times in recent months.
The key levels on the 5M chart are 1.2457, 1.2502, 1.2541-1.2547, 1.2605-1.2633, 1.2684-1.2693, 1.2748, 1.2791 -1.2798, 1.2848-1.2860, 1.2913, 1.2980. The UK economic calendar is practically barren. Yesterday, a Bank of England official delivered a speech and said that the key rate should be lowered, but this did not have any effect on the market. The U.S. docket will feature a retail sales report, which certainly will not stop the unbridled fall of the greenback.
1) Signal strength is determined by the time taken for its formation (either a bounce or level breach). A shorter formation time indicates a stronger signal.
2) If two or more trades around a certain level are initiated based on false signals, subsequent signals from that level should be disregarded.
3) In a flat market, any currency pair can produce multiple false signals or none at all. In any case, the flat trend is not the best condition for trading.
4) Trading activities are confined between the onset of the European session and mid-way through the U.S. session, after which all open trades should be manually closed.
5) On the 30-minute timeframe, trades based on MACD signals are only advisable amidst substantial volatility and an established trend, confirmed either by a trendline or trend channel.
6) If two levels lie closely together (ranging from 5 to 15 pips apart), they should be considered as a support or resistance zone.
Support and Resistance price levels can serve as targets when buying or selling. You can place Take Profit levels near them.
Red lines represent channels or trend lines, depicting the current market trend and indicating the preferable trading direction.
The MACD(14,22,3) indicator, encompassing both the histogram and signal line, acts as an auxiliary tool and can also be used as a signal source.
Significant speeches and reports (always noted in the news calendar) can profoundly influence the price dynamics. Hence, trading during their release calls for heightened caution. It may be reasonable to exit the market to prevent abrupt price reversals against the prevailing trend.
Beginners should always remember that not every trade will yield profit. Establishing a clear strategy coupled with sound money management is the cornerstone of sustained trading success.
InstaForex analytical reviews will make you fully aware of market trends! Being an InstaForex client, you are provided with a large number of free services for efficient trading.

