 Permanecer
Condições de Negociações
Ferramentas


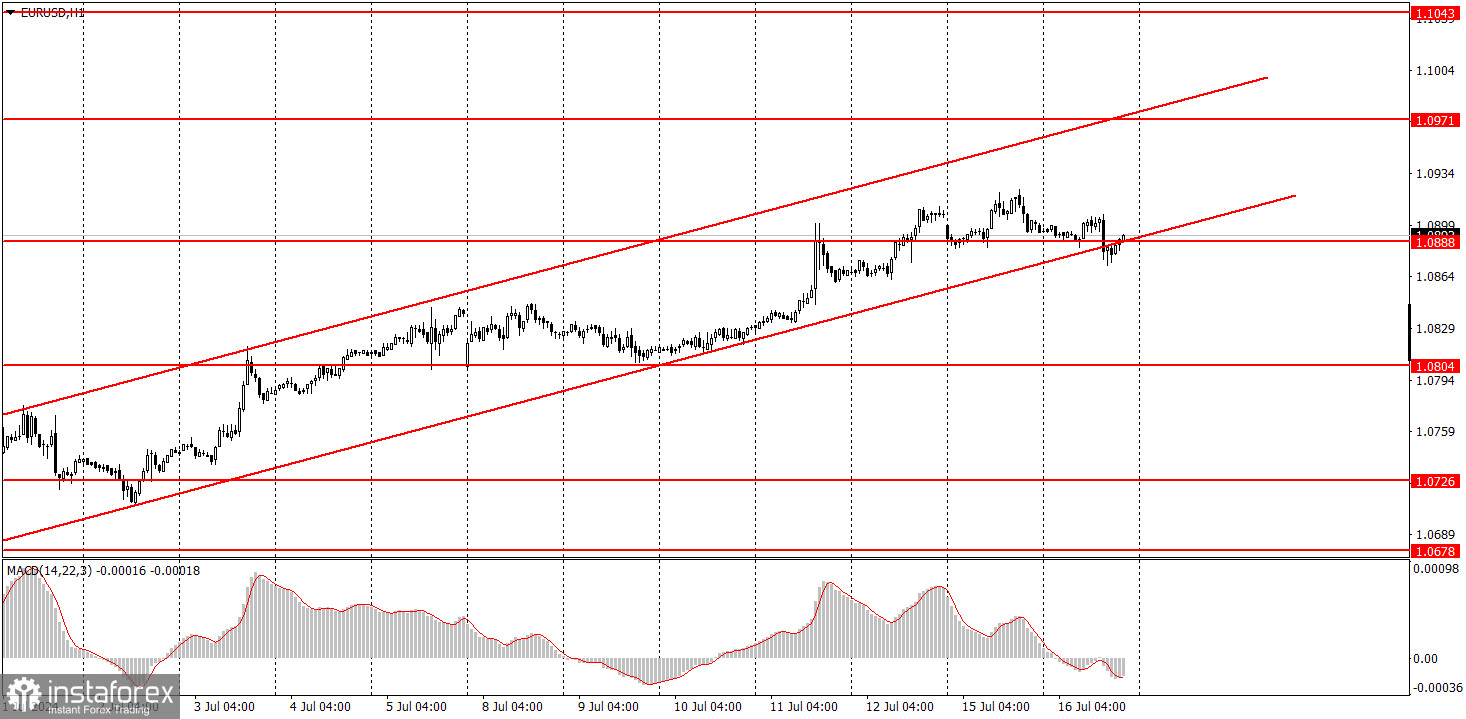
EUR/USD faced negative pressure on Tuesday and even broke through the lower boundary of the ascending channel. However, the movements of the last two days were so weak that it is very difficult to say what kind of movement we are dealing with now. The main problem is about illogical movement and weak volatility. As of today, it is about 40 pips, which is very little even for the euro. Therefore, in any case, we cannot count on strong movements.
Reports on U.S. retail sales and ZEW Economic Sentiment Index for Germany and the bloc were published. All three reports supported the dollar. European indices turned out to be much weaker than expected, and the retail sales report was stronger as the May value was revised upwards. How much has the dollar risen in price based on these data? Not much.
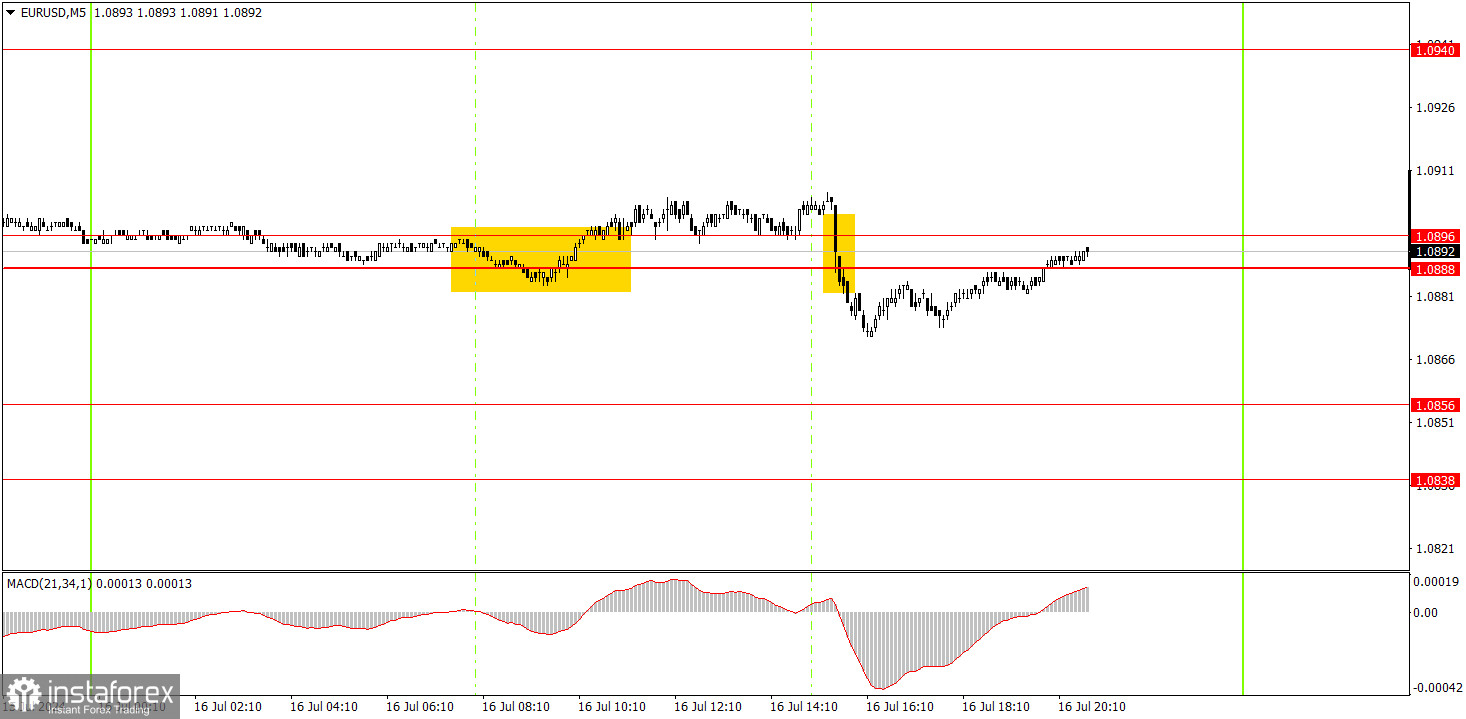
Two trading signals were generated on the 5-minute timeframe, but volatility was extremely weak, so novice traders did not receive any profit. We have repeatedly mentioned that if the market is stagnant, then it is extremely difficult to count on profit with any trading signals. At the beginning of the U.S. session, volatility surged after the retail sales report. The dollar rose by 20 pips, and by the end of the day it managed to lose "all the hard-earned money".
On the hourly chart, EUR/USD continues its local upward trend. Sometimes the market has a good reason to buy the pair, and when it doesn't, it just comes up with a reason. The single currency is firmly rising almost every day. The current movement seems illogical, but from a technical perspective, everything appears natural.
On Wednesday, novice traders can stay in short positions based on the signal of consolidation below the area of 1.0888-1.0896 area. However, there's a high probability of a flat or very weak movements.
The key levels on the 5M chart are 1.0483, 1.0526,1.0568, 1.0611, 1.0678, 1.0726-1.0733, 1.0797-1.0804, 1.0838-1.0856, 1.0888-1, 0896, 1.0940, 1.0971-1.0981. The European Union is set to release the final assessment of its inflation report for June. We don't expect any market reaction to this report. The U.S. docket will feature reports on industrial production, building permits and housing starts. These are minor reports that can provoke a market reaction of at most 20 pips.
1) Signal strength is determined by the time taken for its formation (either a bounce or level breach). A shorter formation time indicates a stronger signal.
2) If two or more trades around a certain level are initiated based on false signals, subsequent signals from that level should be disregarded.
3) In a flat market, any currency pair can produce multiple false signals or none at all. In any case, the flat trend is not the best condition for trading.
4) Trading activities are confined between the onset of the European session and mid-way through the U.S. session, after which all open trades should be manually closed.
5) On the 30-minute timeframe, trades based on MACD signals are only advisable amidst substantial volatility and an established trend, confirmed either by a trendline or trend channel.
6) If two levels lie closely together (ranging from 5 to 15 pips apart), they should be considered as a support or resistance zone.
Support and Resistance price levels can serve as targets when buying or selling. You can place Take Profit levels near them.
Red lines represent channels or trend lines, depicting the current market trend and indicating the preferable trading direction.
The MACD(14,22,3) indicator, encompassing both the histogram and signal line, acts as an auxiliary tool and can also be used as a signal source.
Significant speeches and reports (always noted in the news calendar) can profoundly influence the price dynamics. Hence, trading during their release calls for heightened caution. It may be reasonable to exit the market to prevent abrupt price reversals against the prevailing trend.
Beginners should always remember that not every trade will yield profit. Establishing a clear strategy coupled with sound money management is the cornerstone of sustained trading success.
InstaForex analytical reviews will make you fully aware of market trends! Being an InstaForex client, you are provided with a large number of free services for efficient trading.

