 Permanecer
Condições de Negociações
Ferramentas


EUR/USD
Analysis: The downward trend of the EUR/USD pair that started in July last year resembles a horizontal pennant pattern. It moves the euro quotes along groupings of resistance levels across different time frames. The ongoing upward section, starting from April 16th, indicates a need for a counter-correction. After its completion, the final section of the wave will begin.
Forecast: In the coming days, the pair's general upward trend will continue within the price channel between the nearest zones of opposite directions. A flat or short-term decline down to the support level is likely in the early days. We expect the upward movement to resume by the end of the week.
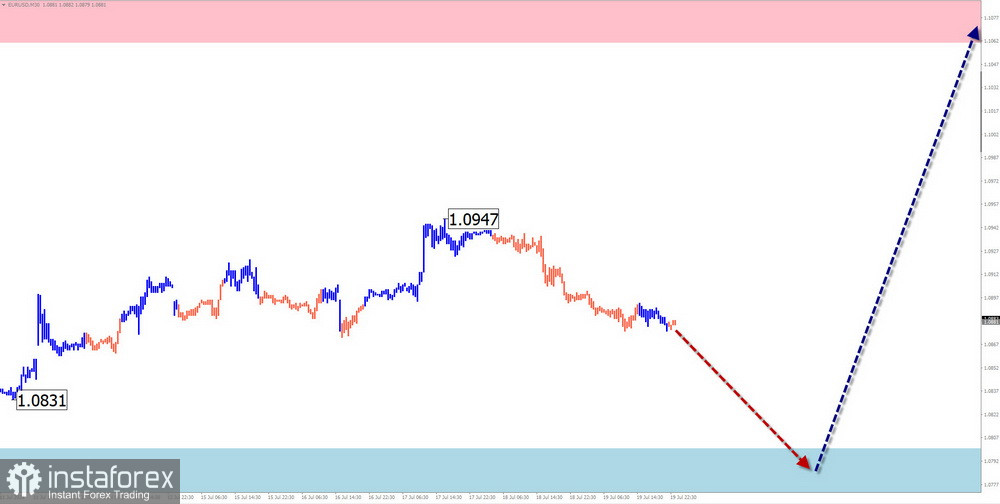
Potential Reversal Zones
Resistance: 1.1060/1.1110
Support: 1.0810/1.0760
Recommendations:
Sales: Possible with a fractional volume; however, it is risky.
Purchases: Will become more favorable once confirmed signals appear near the support zone.
USD/JPY
Analysis: The USD/JPY pair quotes continue moving upward on the price chart. For the last three weeks, the price has been forming a correction from the reached strong resistance. Its structure at the time of analysis appears completed. At the end of last week, the price rebounded from the upper boundary of the strong potential reversal zone.
Forecast: The downward movement vector is expected to be completed in the coming days. In the first few days, sideways movement along the support boundaries is not excluded. Increased volatility and a change of direction can be expected in the second half of the week. At the reversal, a brief break below the lower boundary of the estimated zone is possible.
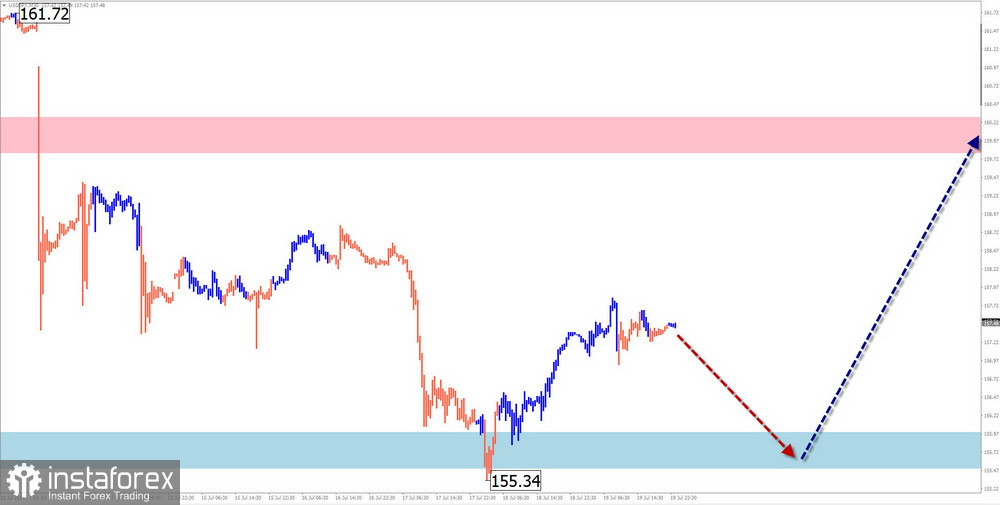
Potential Reversal Zones
Resistance: 159.80/160.30
Support: 156.00/155.50
Recommendations:
Sales: No conditions for such trades in the pair market in the upcoming week.
Purchases: According to your trading systems, they will become relevant after corresponding signals appear near the support zone.
GBP/JPY
Analysis: The trend of the GBP/JPY pair has been directed towards the upper part of the price chart in recent years. The unfinished section of this wave is corrective and has been counted since July 11th. The price is moving sideways, forming an elongated plane. The structure of this movement is in its final phase.
Forecast: The end of the downward movement vector is expected at the beginning of the upcoming week. Then, conditions for a reversal can be expected to form near the support zone. The resumption of the price rise, with a sharp increase in volatility, can be expected by the end of the week. The synchronization of the reversal timing with the release of important news blocks is highly likely.
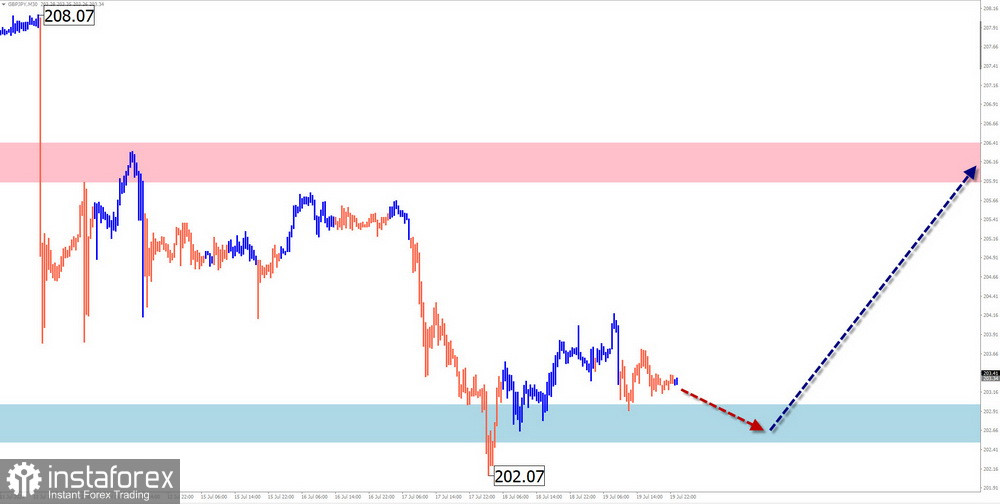
Potential Reversal Zones
Resistance: 205.90/206.40
Support: 203.00/202.50
Recommendations:
Sales: Unfavorable conditions for trades. High probability of loss.
Purchases: Can be used in trading upon the appearance of confirmed signals near the calculated support.
USD/CAD
Analysis: In the market for the USD/CAD pair, a bearish wave has continued to form since mid-April of this year. This section of the chart forms a corrective segment (B) for a larger wave model. Its structure at the time of analysis does not show completion.
Forecast: The general direction of sideways movement is expected to continue throughout the week. In the coming days, an upward vector is more likely, up to its completion near the estimated resistance. Then, a change in course and the resumption of the bearish movement direction can be expected. Breaking the boundaries of the price channel in the upcoming week is unlikely.
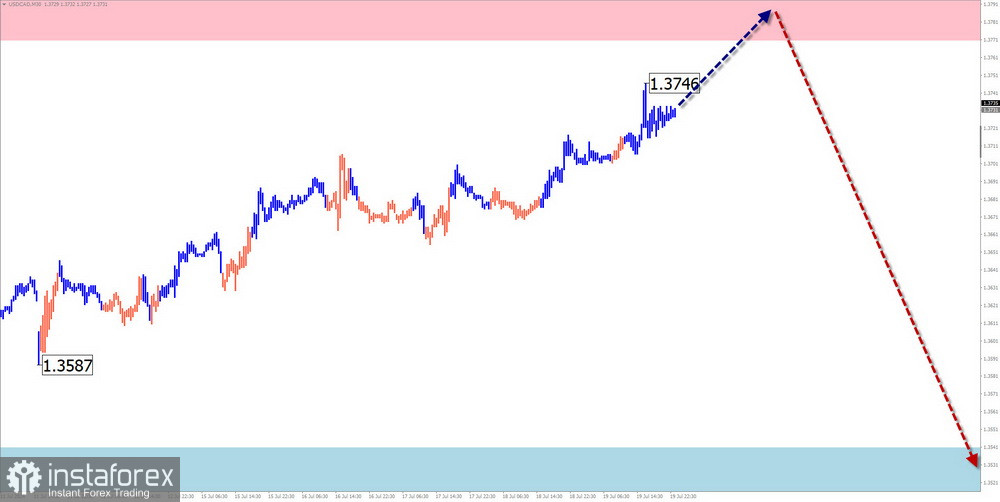
Potential Reversal Zones
Resistance: 1.3770/1.3820
Support: 1.3540/1.3490
Recommendations:
Sales: Will become relevant after confirmed signals appear near the estimated resistance zone.
Purchases: Possible within individual sessions. The potential is limited by resistance.
NZD/USD
Brief Analysis: Since December last year, the quotes in the NZD/USD pair have been moving predominantly sideways along a strong resistance zone. The wave extremes have formed a horizontal pennant on the chart. The unfinished downward section is from May 16th. Its wave level does not have reversal potential.
Weekly Forecast: The sideways movement vector is expected to continue in the upcoming week. In the early days, a short-term decline is not excluded, but not below the support levels. The highest volatility can be expected closer to the weekend.
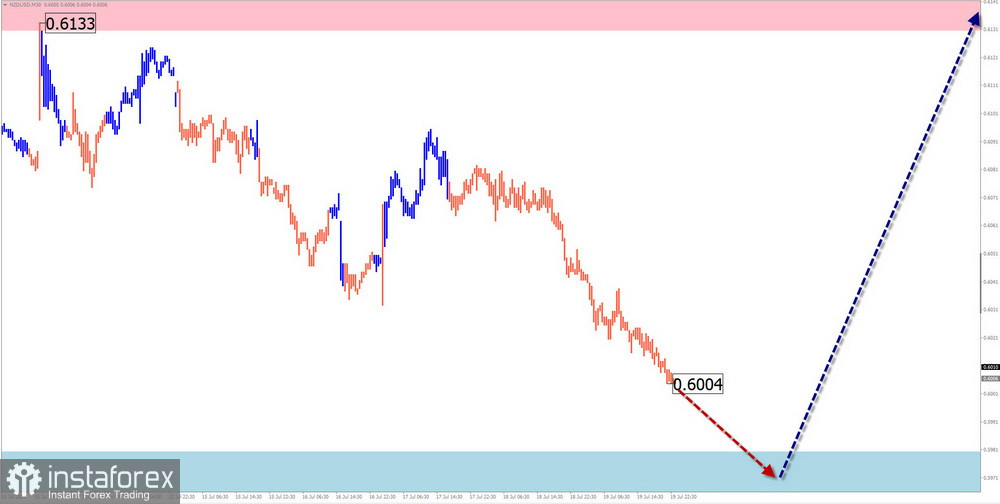
Potential Reversal Zones
Resistance: 0.6130/0.6180
Support: 0.5980/0.5930
Recommendations:
Sales: Possible within individual sessions but carry higher risk. It is advisable to reduce the volume to a minimum.
Purchases: After the appearance of corresponding reversal signals, they can become the main direction for trading deals.
Gold
Analysis: Despite the declining US dollar, the gold market continues to grow. Since October last year, the movement direction has set the algorithm for a bullish wave. An intermediate correction in a shifting plane forms from a strong potential reversal zone on the daily time frame.
Forecast: The gold price will move sideways along the resistance zone in the next few days. In the second half of the week, the resumption of the bearish movement course is expected, with a decline to the estimated support boundaries.
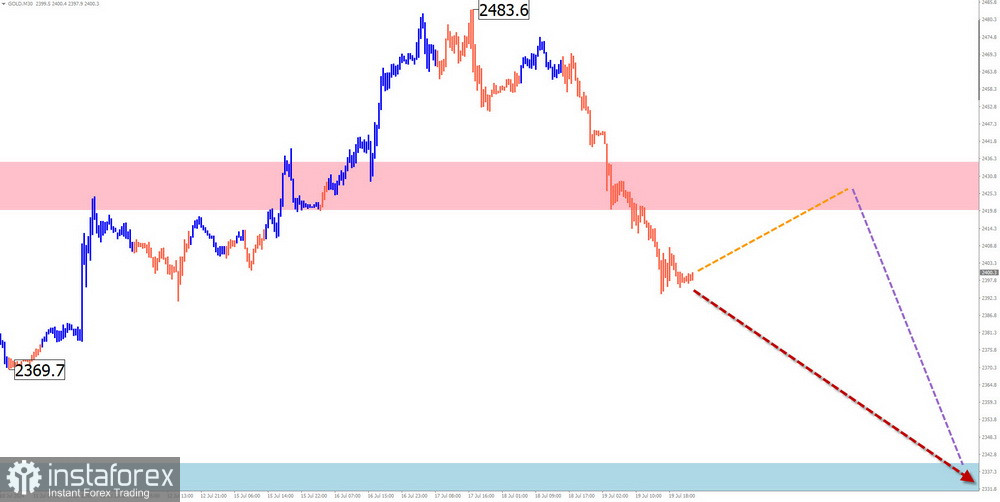
Potential Reversal Zones
Resistance: 2420.0/2440.0
Support: 2340.0/2320.0
Recommendations:
Sales: Will be possible after corresponding signals in the resistance area appear. Support limits the downside potential.
Purchases: Are highly risky and may lead to losses.
Explanations: In simplified wave analysis (SWA), all waves consist of 3 parts (A-B-C). The last unfinished wave is analyzed on each time frame. Expected movements are shown with a dashed line.
Note: The wave algorithm does not consider the duration of the instruments' movements over time!
InstaForex analytical reviews will make you fully aware of market trends! Being an InstaForex client, you are provided with a large number of free services for efficient trading.


