 Permanecer
Condições de Negociações
Ferramentas


On Wednesday, EUR/USD once again demonstrated and proved that it simply does not want to move. Important reports were released in the European Union on Tuesday, and there were significant reports in both the European Union and the United States on Wednesday, along with the Federal Reserve meeting. And what kind of volatility do we see these days? 37 and 44 pips. We've been talking about low volatility for several months now, as it's a critical factor in the currency market at this time. How can one trade a pair that only moves 30-40 pips daily? It's important to understand that this isn't a 40-pip one-sided move where you can enter at the start and exit at the end. In the last two days, the market has also been flat.
Fed Chair Jerome Powell didn't provide traders anything interesting yesterday, and the Fed did not change the key rate. The U.S. ADP report briefly lowered demand for the dollar but had no lasting impact.
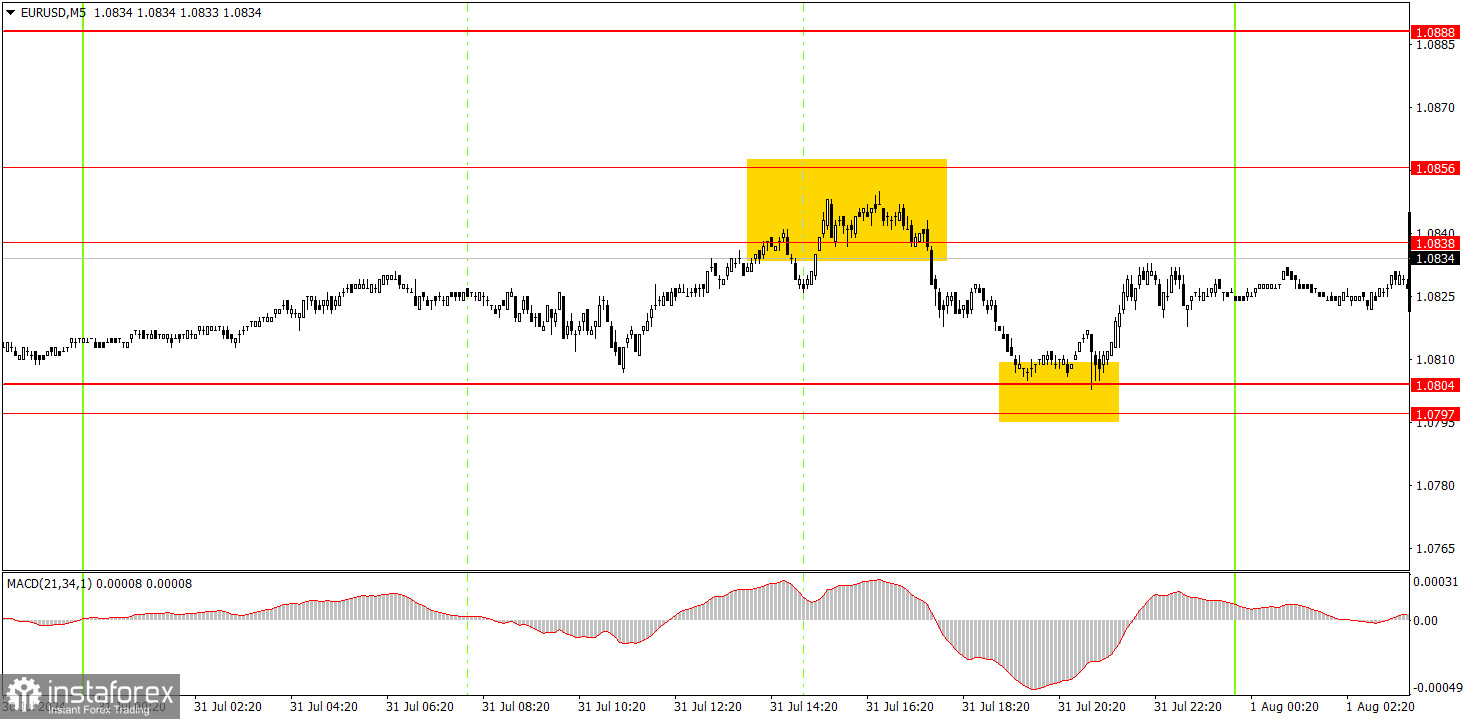
Two trading signals were formed in the 5-minute timeframe on Wednesday. At the start of the U.S. trading session, the price bounced off the 1.0838-1.0856 area, and closer to the end of the day, it tested the 1.0797-1.0804 area and bounced off it. The first signal could have brought beginners about 20 pips of profit at best. It was not advisable to trade the second signal since the market's reaction to Powell's speech could have been unpredictable.
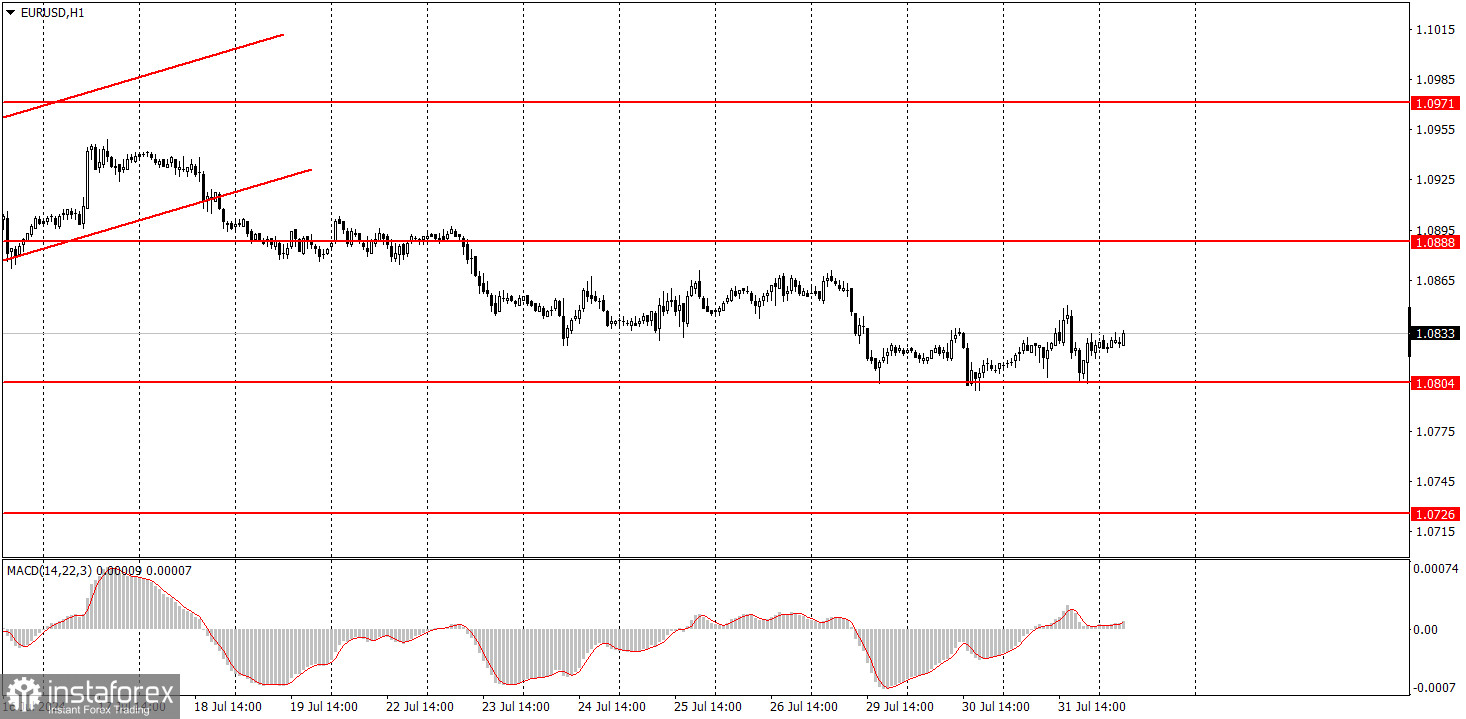
In the hourly time frame, EUR/USD consolidated below the ascending channel, allowing it to start a new local downward trend. We believe the euro has fully factored in all the bullish factors, so a significant correction is needed. However, the nature of the movements is best seen in the 24-hour timeframe. The pair is flat within the range between 1.0600 and 1.1000. Volatility remains low, and the market has stopped reacting to macro data and events.
On Thursday, novice traders can trade from the 1.0838-1.0856 area again. However, volatility remains low, and even the macroeconomic background is not helping.
The key levels to consider on the 5M timeframe are 1.0526, 1.0568, 1.0611, 1.0678, 1.0726-1.0733, 1.0797-1.0804, 1.0838-1.0856, 1.0888-1.0896, 1.0940, 1.0971-1.0981. Today, the Eurozone is scheduled to publish business activity indexes and the unemployment rate. In the U.S., the important ISM index for the manufacturing sector will be released. However, the first half of the week has already shown us that no news can push the market trade more actively. The pair is simply standing still.
1) The strength of a signal is determined by the time it took for the signal to form (bounce or level breakthrough). The shorter the time required, the stronger the signal.
2) If two or more trades around a certain level are initiated based on false signals, subsequent signals from that level should be ignored.
3) In a flat market, any currency pair can produce multiple false signals or none at all. In any case, it's better to stop trading at the first signs of a flat market.
4) Trades should be opened between the start of the European session and mid-way through the U.S. session. All trades must be closed manually after this period.
5) In the hourly time frame, trades based on MACD signals are only advisable amidst substantial volatility and an established trend, confirmed either by a trendline or trend channel.
6) If two levels are too close to each other (from 5 to 20 pips), they should be considered as a support or resistance zone.
7) After moving 15 pips in the intended direction, the Stop Loss should be set to break-even.
Support and Resistance price levels can serve as targets when buying or selling. You can place Take Profit levels near them.
Red lines represent channels or trend lines that depict the current trend and indicate the preferred trading direction.
The MACD (14,22,3) indicator, encompassing both the histogram and signal line, acts as an auxiliary tool and can also be used as a source of signals.
Important speeches and reports (always noted in the news calendar) can profoundly influence the price dynamics. Hence, trading during their release calls for heightened caution. It may be reasonable to exit the market to prevent abrupt price reversals against the prevailing trend.
Beginners should always remember that not every trade will yield profit. Establishing a clear strategy, coupled with effective money management, is key to long-term success in trading.
InstaForex analytical reviews will make you fully aware of market trends! Being an InstaForex client, you are provided with a large number of free services for efficient trading.


