 Permanecer
Condições de Negociações
Ferramentas


On Thursday, the EUR/USD pair attempted to sustain its logical decline, but this time, the bears encountered an insurmountable obstacle near the nearest level of 1.0888. It is worth noting that traders were highly active at the beginning of this week, but volatility decreased, and the macroeconomic and fundamental background has been absent in recent days. Thus, we can only rely on technical analysis. What does it tell us now?
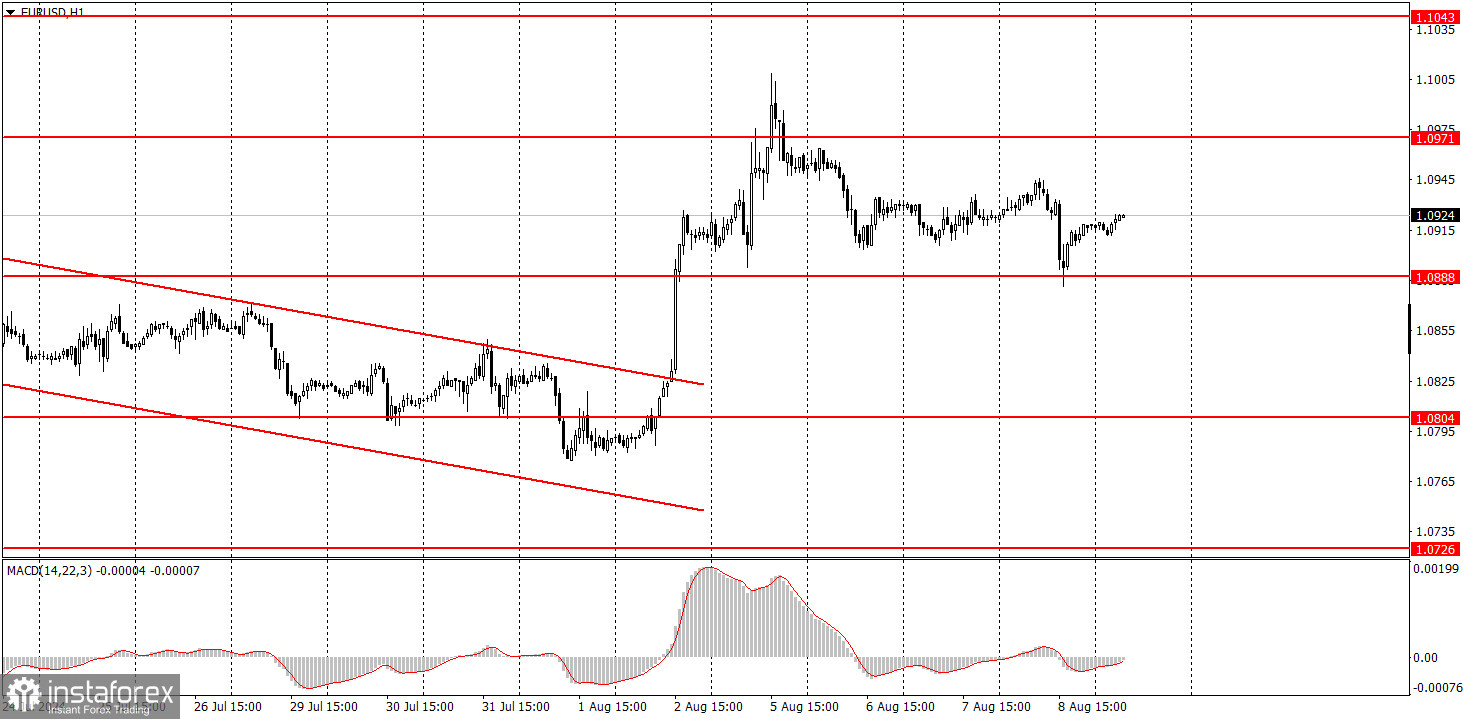
We believe the most important thing at the moment is the horizontal channel on the daily time frame from 1.0600 to 1.1000. The price has been within this range for seven months. Since the price has worked out the upper boundary of this channel this week, we should now expect it to fall to the lower boundary. Thus, we believe that the euro will continue to decline. Yes, it will likely be slow, but we see no reason to expect further growth of the pair. This does not mean that it cannot happen.
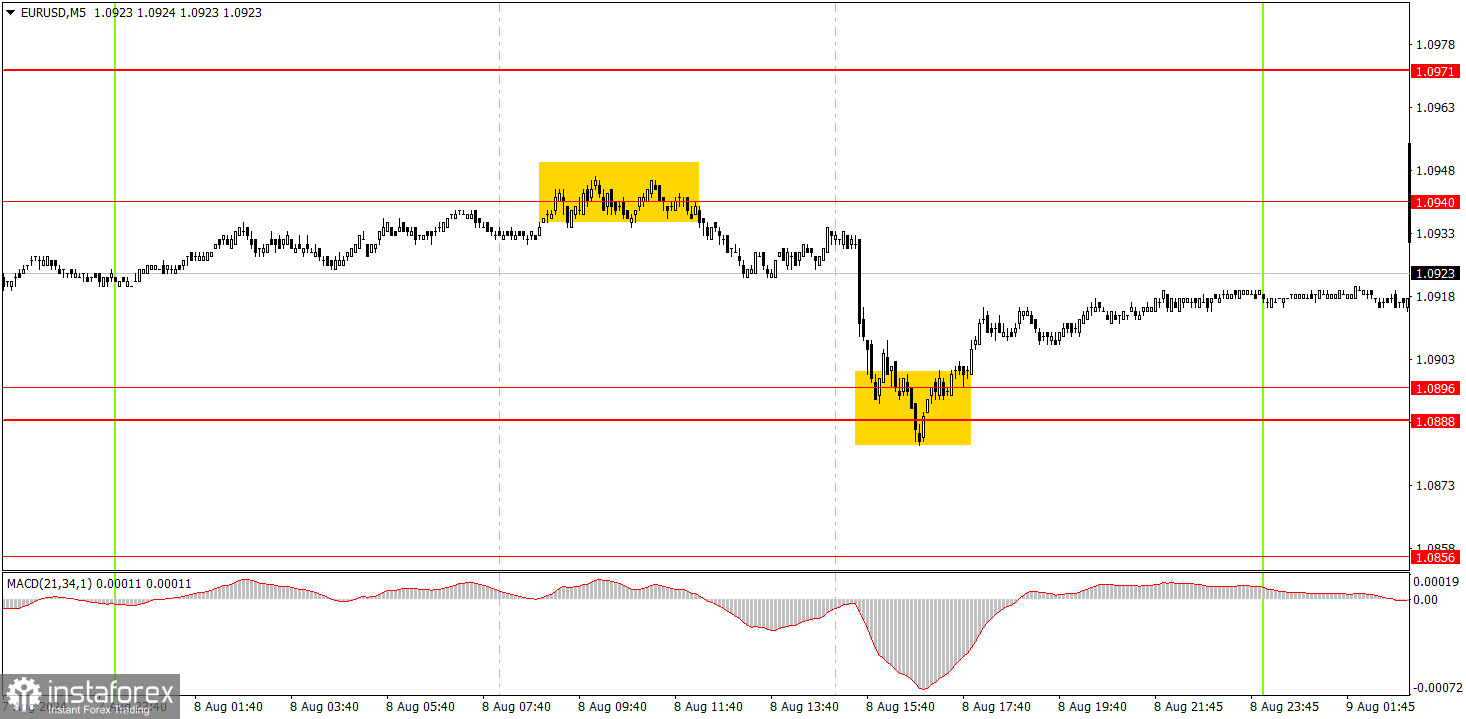
Two decent trading signals were formed in the 5-minute time frame on Thursday. First, the pair rebounded from 1.0940, then dropped to 1.0888-1.0896 and bounced from there. Thus, beginners could open two trading positions, each of which turned out to be profitable. Traders could earn about 25 pips from the first sell transaction and about ten pips from the second.
EUR/USD broke the short-term downward trend in the hourly time frame. We believe the euro has fully factored in all the bullish factors, so we do not expect the upward movement to continue. The pair remains flat in the 1.06-1.10 range in the 24-hour time frame. There are currently no reasons to leave this range. As before, we only expect the euro to fall, as the European Central Bank has begun easing monetary policy while the Federal Reserve has not.
On Friday, novice traders can remain in long positions after the price rebounds from 1.0888-1.0896, but today's movements are unlikely to be strong.
The key levels to consider on the 5M time frame are 1.0526, 1.0568, 1.0611, 1.0678, 1.0726-1.0733, 1.0797-1.0804, 1.0838-1.0856, 1.0888-1.0896, 1.0940, 1.0971, 1.1011, 1.1043, 1.1091. Only the second estimate of the Consumer Price Index in Germany for July is scheduled to be published on Friday. This estimate is unlikely to differ from the first, so we do not expect a market reaction, or it will be extremely weak.
1) The strength of a signal is determined by the time it took for the signal to form (bounce or level breakthrough). The shorter the time required, the stronger the signal.
2) If two or more trades around a certain level are initiated based on false signals, subsequent signals from that level should be ignored.
3) In a flat market, any currency pair can produce multiple false signals or none at all. In any case, it's better to stop trading at the first signs of a flat market.
4) Trades should be opened between the start of the European session and mid-way through the U.S. session. All trades must be closed manually after this period.
5) In the hourly time frame, trades based on MACD signals are only advisable amidst substantial volatility and an established trend, confirmed either by a trendline or trend channel.
6) If two levels are too close to each other (from 5 to 20 pips), they should be considered as a support or resistance zone.
7) After moving 15 pips in the intended direction, the Stop Loss should be set to break-even.
Support and Resistance price levels: targets when opening long or short positions. You can place Take Profit levels near them.
Red lines represent channels or trend lines that depict the current trend and indicate the preferred trading direction.
The MACD (14,22,3) indicator, encompassing both the histogram and signal line, acts as an auxiliary tool and can also be used as a source of signals.
Important speeches and reports (always noted in the news calendar) can profoundly influence the price dynamics. Hence, trading during their release calls for heightened caution. It may be reasonable to exit the market to prevent abrupt price reversals against the prevailing trend.
Beginners should always remember that not every trade will yield profit. Establishing a clear strategy, coupled with effective money management, is key to long-term success in trading.
InstaForex analytical reviews will make you fully aware of market trends! Being an InstaForex client, you are provided with a large number of free services for efficient trading.

