 Permanecer
Condições de Negociações
Ferramentas


On Monday, the GBP/USD pair sustained its upward movement in line with the current uptrend. As we have mentioned numerous times, the market needs no reason to buy the pair now. On Monday, neither the UK nor the U.S. published any reports. Nevertheless, we saw another rise in the British currency, which is no longer surprising. The market continues to sell the dollar based on expectations of an interest rate cut by the Federal Reserve in September. It doesn't matter that market participants have been waiting for this since the beginning of the year and acting on what has not even happened yet—this has been the case for eight months straight. At the same time, they are not particularly interested in the easing of the Bank of England's monetary policy.
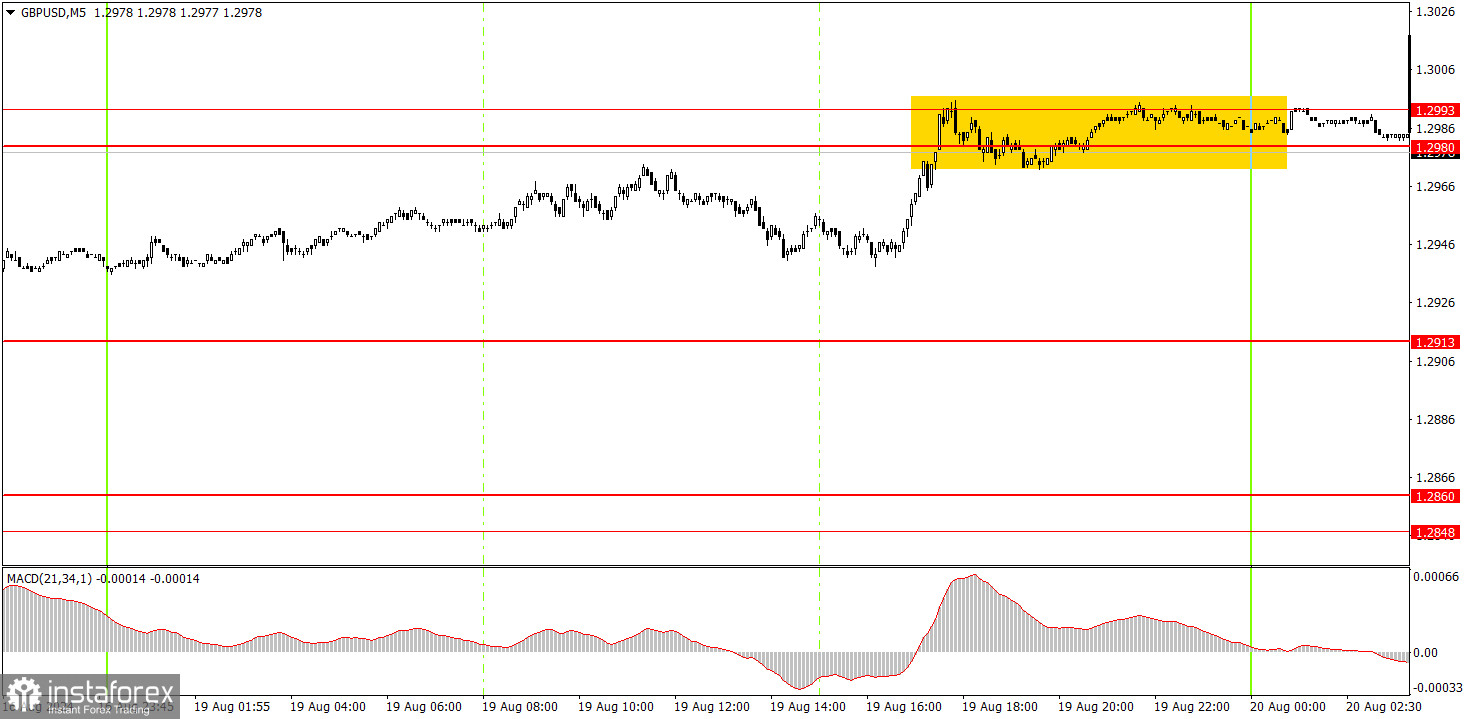
No trade signals were formed on Monday in the 5-minute time frame that could be executed. By the end of the day, the pair reached the area of 1.2980-1.2993, from which a rebound and downward correction are possible. However, selling the pair during a strong uptrend is not the most reasonable approach. A price consolidation above the 1.2980-1.2993 area would suggest further potential growth for the British currency.
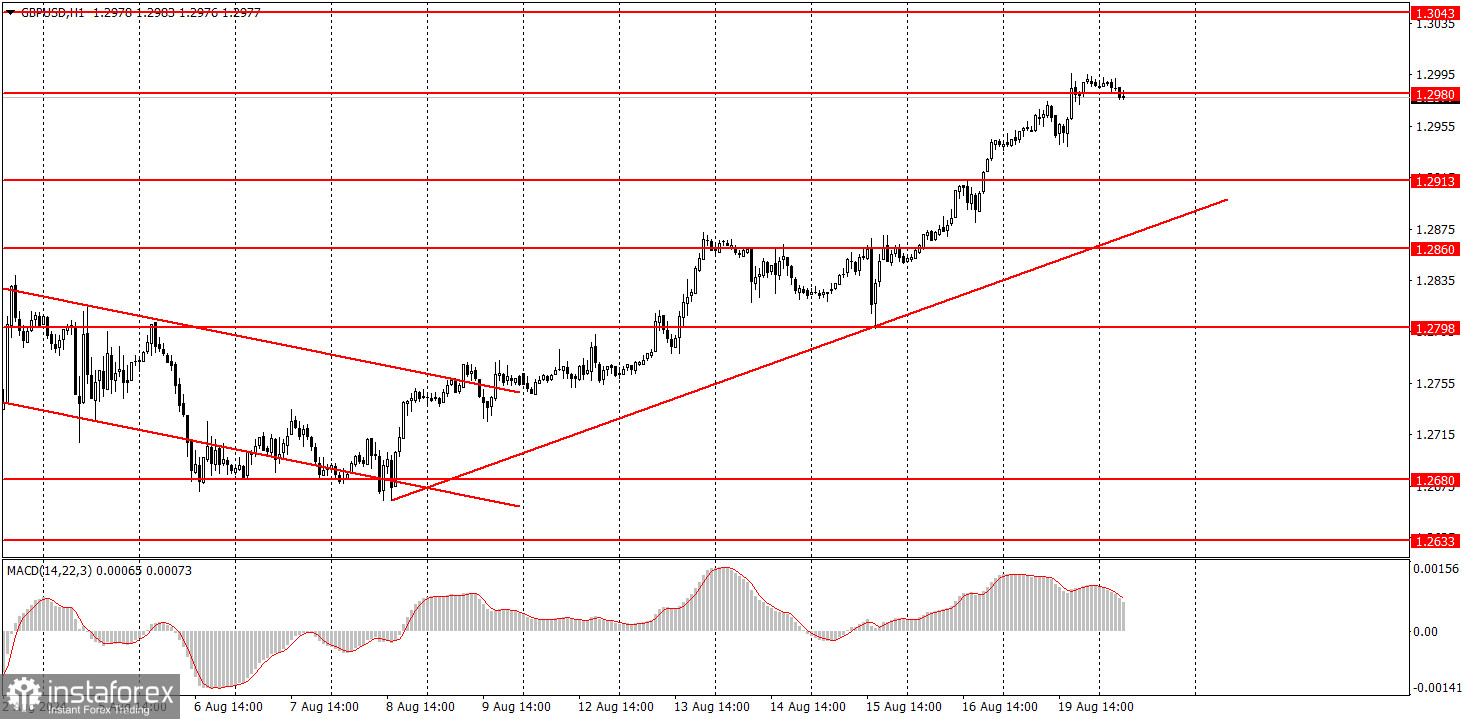
In the hourly time frame, GBP/USD has a good chance of continuing the downtrend, but it is currently going through an upward correction. The British pound is still overbought, while the dollar is undervalued, and the market continues to use every opportunity to buy the British currency and sell the dollar. It often ignores any unfavorable reports. The rare positive reports from the U.S., which appear from time to time, only lead to minor downward corrections.
On Tuesday, the pair may pull back down a bit, but the uptrend is unlikely to be broken. Trading during the day can be conducted from the area of 1.2980-1.2993.
The key levels to consider on the 5M timeframe are 1.2547, 1.2605-1.2633, 1.2684-1.2693, 1.2748, 1.2791-1.2798, 1.2848-1.2860, 1.2913, 1.2980-1.2993, 1.3043, 1.3102-1.3107, and 1.3145. No important events are scheduled on Tuesday in the UK or the U.S. However, Monday showed us that the market can trade higher without a fundamental or macroeconomic backdrop.
1) The strength of a signal is determined by the time it takes for the signal to form (bounce or level breakthrough). The less time it took, the stronger the signal.
2) If two or more trades around a certain level are initiated based on false signals, subsequent signals from that level should be ignored.
3) In a flat market, any currency pair can form multiple false signals or none at all. In any case, it's better to stop trading at the first signs of a flat market.
4) Trades should be opened between the start of the European session and midway through the U.S. session. After this period, all trades must be closed manually.
5) In the hourly time frame, trades based on MACD signals are only advisable amidst substantial volatility and an established trend confirmed by a trendline or trend channel.
6) If two levels are too close to each other (5 to 20 pips), they should be considered support or resistance.
7) After moving 20 pips in the intended direction, the Stop Loss should be set to break even.
Support and Resistance price levels: targets for opening long or short positions. You can place Take Profit levels near them.
Red lines: channels or trend lines that depict the current trend and indicate the preferred trading direction.
The MACD (14,22,3) indicator, encompassing both the histogram and signal line, acts as an auxiliary tool and can also be used as a source of signals.
Important speeches and reports (always noted in the news calendar) can profoundly influence the movement of a currency pair. Hence, trading during their release calls for heightened caution. It may be reasonable to exit the market to prevent abrupt price reversals against the prevailing trend.
Beginners should always remember that not every trade will yield profit. Developing a clear strategy and effective money management is key to success in trading over a long period.
InstaForex analytical reviews will make you fully aware of market trends! Being an InstaForex client, you are provided with a large number of free services for efficient trading.


