 Permanecer
Condições de Negociações
Ferramentas


The GBP/USD pair traded higher on Wednesday based on the same JOLTS report. The number of job openings in July was significantly lower than the market expected, though what else could be expected if the unemployment rate in July increased? Nonetheless, the market was again disappointed by weak US data, weakened both by its expectations and those of experts. It's important to remember that for market participants, it's not the actual value that matters but whether it meets the forecast. If the forecast is repeatedly set too high, it will never be met, and the US dollar could continue to fall for a couple more years. But such is the reality of the currency market at the moment. There are still two days left in the week, and plenty of important macroeconomic data will be published. And the GBP/USD pair has moved only a tiny distance from its last local high. If the remaining reports on labor, business activity, and unemployment also fail, the pound could return to the level of 1.3250 this week.
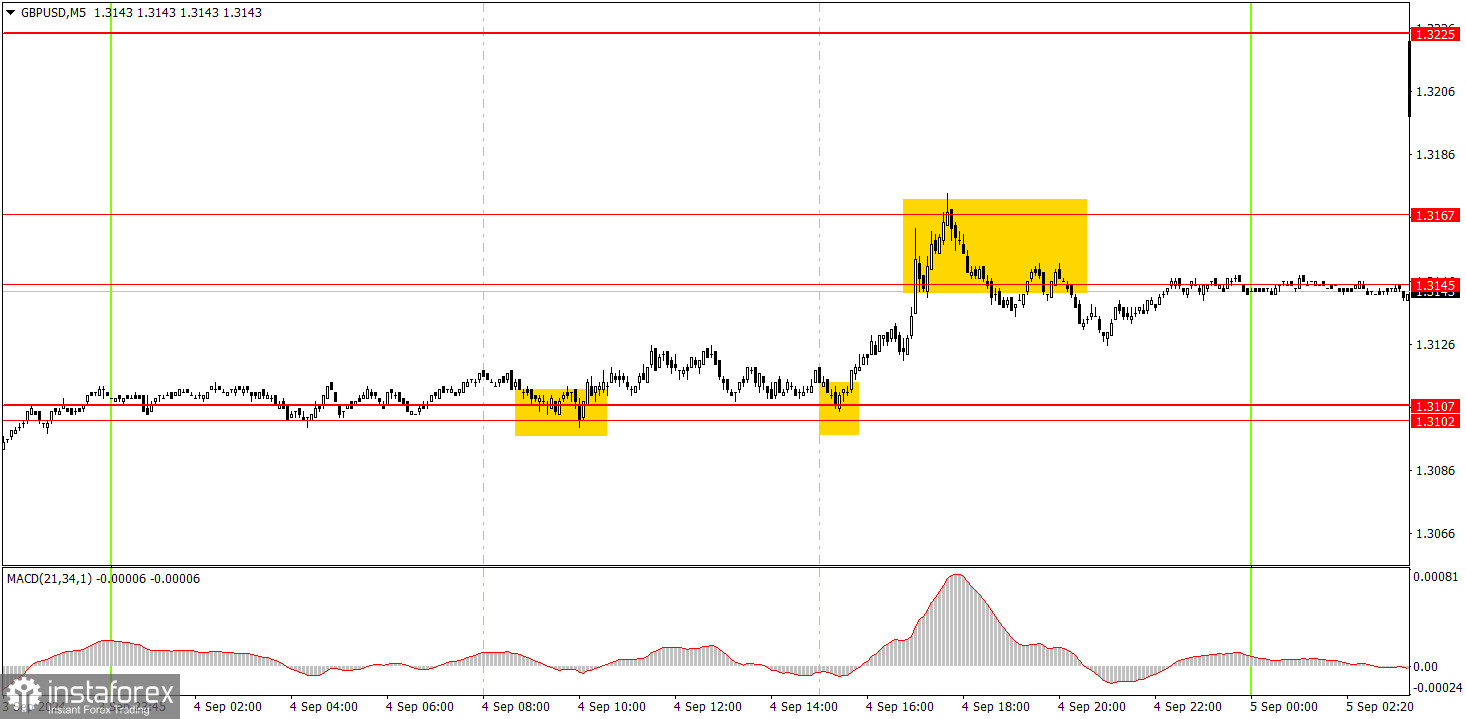
Two buy signals were formed in the 5-minute time frame on Wednesday. The price rebounded twice from the area of 1.3102-1.3107 and then rose to the area of 1.3145-1.3167, from which it also rebounded. Thus, long positions could have brought novice traders several dozen pips of profit. The rebound from the area of 1.3145-1.3167 could also have been executed, but today, the pair could well continue its rise if the US reports again turn out weaker than forecasts.
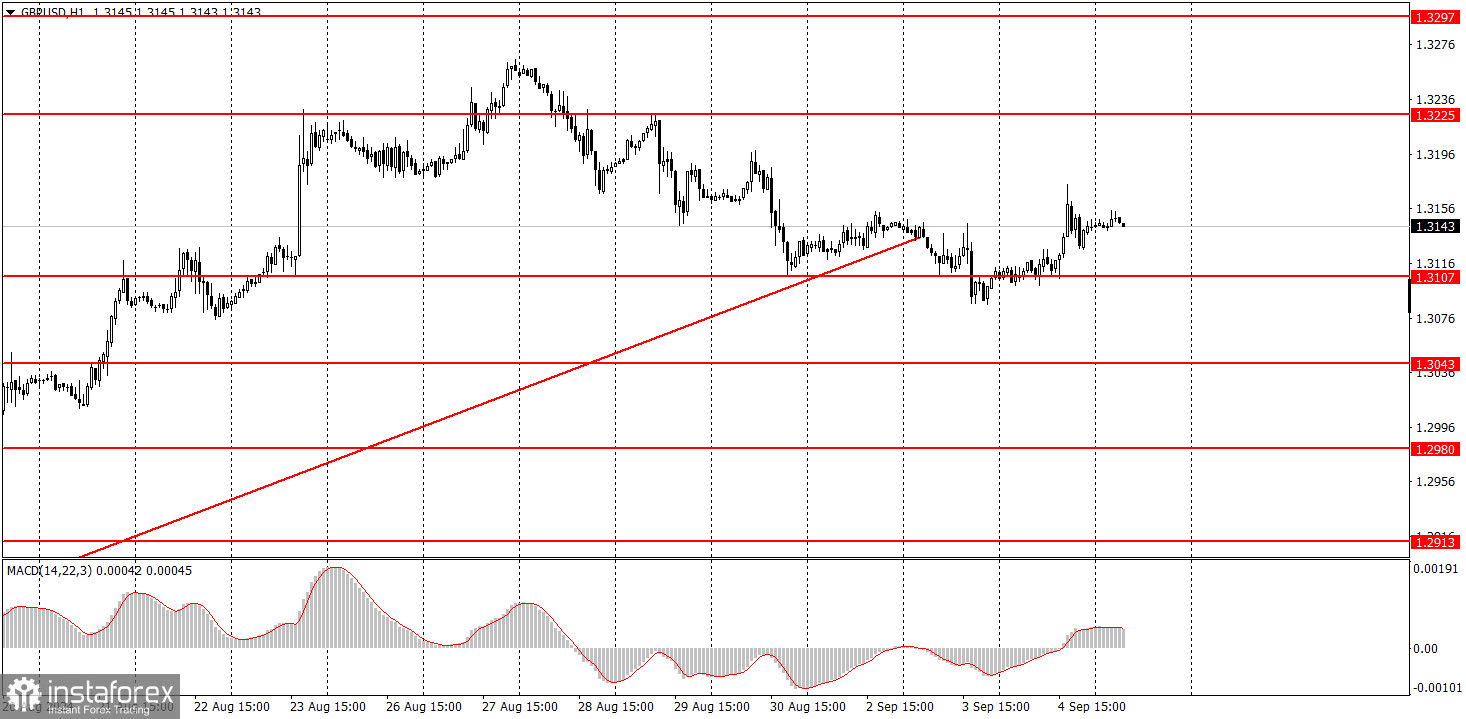
In the hourly time frame, GBP/USD has a good chance of resuming the global downward trend or at least experiencing some decline. The British pound remains overbought, the dollar is undervalued, and the market continues to use every opportunity to buy the British currency and sell the dollar. For now, the pound is only showing a minor bearish correction, and it's too early to talk about a full-fledged downtrend.
On Thursday, the pair may continue to move downward as the trend line has been breached. Yesterday, the price rebounded from the area of 1.3145-1.3167. However, today's dollar rate will also depend on US macro data.
The key levels to consider on the 5M timeframe are 1.2605-1.2633, 1.2684-1.2693, 1.2748, 1.2791-1.2798, 1.2848-1.2860, 1.2913, 1.2980-1.2993, 1.3043, 1.3102-1.3107, 1.3145-1.3167, 1.3225, 1.3272, 1.3310. On Wednesday, the UK will publish a secondary report on business activity in the construction sector, which is the second estimate for August. More important reports, such as ADP and the ISM in the services sector, will be released in the US. Major movements should again be expected in the second half of the day.
1) The strength of a signal is determined by the time it takes for the signal to form (bounce or level breakthrough). The less time it took, the stronger the signal.
2) If two or more trades around a certain level are initiated based on false signals, subsequent signals from that level should be ignored.
3) In a flat market, any currency pair can form multiple false signals or none at all. In any case, it's better to stop trading at the first signs of a flat market.
4) Trades should be opened between the start of the European session and midway through the U.S. session. After this period, all trades must be closed manually.
5) In the hourly time frame, trades based on MACD signals are only advisable amidst substantial volatility and an established trend confirmed by a trendline or trend channel.
6) If two levels are too close to each other (5 to 20 pips), they should be considered support or resistance.
7) After moving 20 pips in the intended direction, the Stop Loss should be set to break even.
Support and Resistance price levels: targets for opening long or short positions. You can place Take Profit levels near them.
Red lines: channels or trend lines that depict the current trend and indicate the preferred trading direction.
The MACD (14,22,3) indicator, encompassing both the histogram and signal line, acts as an auxiliary tool and can also be used as a source of signals.
Important speeches and reports (always noted in the news calendar) can profoundly influence the movement of a currency pair. Hence, trading during their release calls for heightened caution. It may be reasonable to exit the market to prevent abrupt price reversals against the prevailing trend.
Beginners should always remember that not every trade will yield profit. Developing a clear strategy and effective money management is key to success in trading over a long period.
InstaForex analytical reviews will make you fully aware of market trends! Being an InstaForex client, you are provided with a large number of free services for efficient trading.


