 Permanecer
Condições de Negociações
Ferramentas


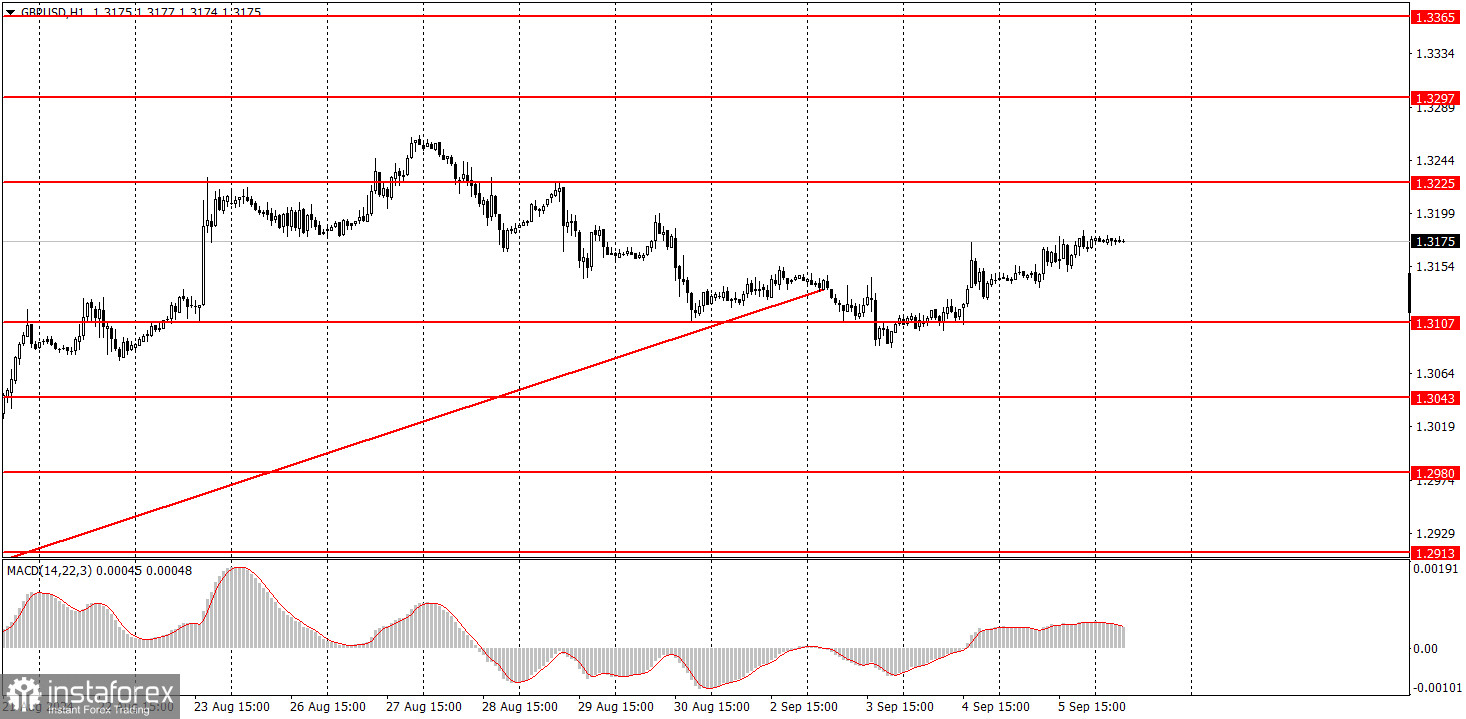
On Thursday, the GBP/USD pair also sustained its upward movement. The rise of the British currency, or rather the dollar's fall, was again triggered by weak US data. Although the ISM services business activity index was better than forecasts, the demand for the dollar hardly increased, as the ADP report on the number of employees in the private sector was at its lowest in the last few years. Thus, the pair is trying to resume its rise without properly correcting. The market has been pricing in the Federal Reserve's monetary policy easing for months and is now reacting to weak US macroeconomic data, while the weak UK economy and the Bank of England's monetary easing policy are of no interest. This situation may continue in the future. Today, the dollar's fate will depend exclusively on reports on the labor market and unemployment.
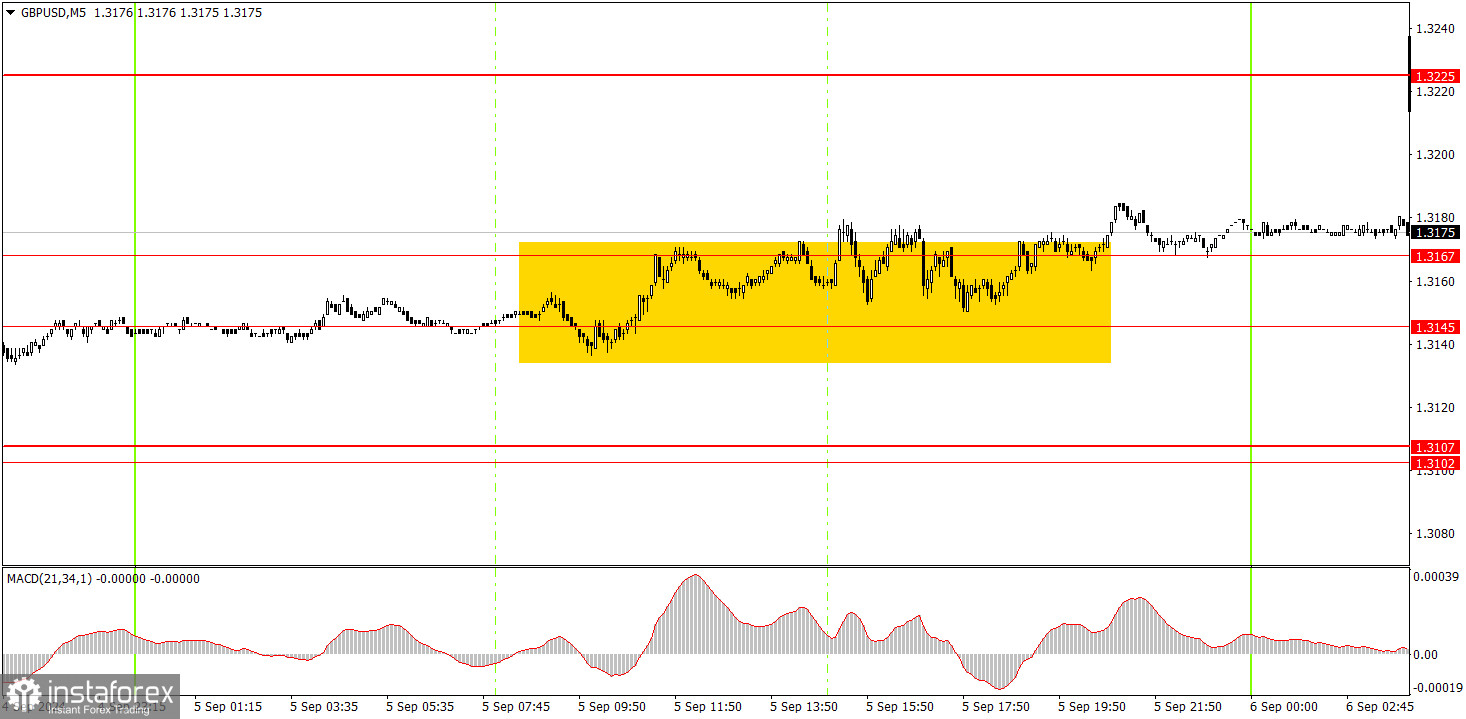
In the 5-minute time frame on Thursday, the price traded sideways practically all day. Yes, a slight increase was recorded by the end of the day, but the nature of the movement did not change. The price can stand still for 23 hours and rise by 20 pips in one hour. Here's your cumulative rise of 20 pips amid total flat trading. Yesterday, the price entered the range of 1.3145-1.3167 and spent almost the entire day there. Trades should have been closed, not opened when the price left this range through the upper boundary.
In the hourly time frame, GBP/USD has a good chance of resuming the global downward trend or at least experiencing some decline. The British pound remains overbought, the dollar is undervalued, and the market continues to use every opportunity to buy the British currency and sell the dollar. The pound only shows a minor bearish correction and is inclined to rise again. It is too early to speak of a full-fledged downtrend.
On Friday, the pair can move in any direction, as it will be heavily influenced by the US economic reports. Be prepared for any scenario.
The key levels to consider on the 5M timeframe are 1.2605-1.2633, 1.2684-1.2693, 1.2748, 1.2791-1.2798, 1.2848-1.2860, 1.2913, 1.2980-1.2993, 1.3043, 1.3102-1.3107, 1.3145-1.3167, 1.3225, 1.3272, 1.3310. No significant events are scheduled for Friday in the UK; in the US, the most important reports on the labor market and unemployment will be released. Major movements are expected in the second half of the day.
1) The strength of a signal is determined by the time it takes for the signal to form (bounce or level breakthrough). The less time it took, the stronger the signal.
2) If two or more trades were opened around any level due to false signals, subsequent signals from that level should be ignored.
3) In a flat market, any currency pair can form multiple false signals or none at all. In any case, it's better to stop trading at the first signs of a flat market.
4) Trades should be opened between the start of the European session and midway through the U.S. session. After this period, all trades must be closed manually.
5) In the hourly time frame, trades based on MACD signals are only advisable amidst good volatility and a trend confirmed by a trendline or trend channel.
6) If two levels are too close to each other (5 to 20 pips), they should be considered a support or resistance area.
7) After moving 20 pips in the intended direction, the Stop Loss should be set to break even.
Support and Resistance price levels: targets for opening long or short positions. You can place Take Profit levels around them.
Red lines: channels or trend lines that depict the current trend and indicate the preferred trading direction.
The MACD indicator (14,22,3): encompassing both the histogram and signal line, acts as an auxiliary tool and can also be used as a source of signals.
Important speeches and reports (always noted in the news calendar) can profoundly influence the movement of a currency pair. Hence, trading during their release calls for heightened caution. It may be reasonable to exit the market to avoid sharp price reversals against the prevailing movement.
For beginners, it's important to remember that not every trade will yield profit. Developing a clear strategy and effective money management is key to success in trading over the long term.
InstaForex analytical reviews will make you fully aware of market trends! Being an InstaForex client, you are provided with a large number of free services for efficient trading.


