 Permanecer
Condições de Negociações
Ferramentas


The EUR/USD pair showed only extremely weak volatility on Tuesday and nothing else. In principle, this is not surprising, as there were no macroeconomic or fundamental factors in the Eurozone or the U.S. yesterday. Only the second estimate of Germany's Consumer Price Index for August was published. As expected, the second estimate did not differ from the first.
The most important U.S. inflation report will be released today, and the European Central Bank meeting will take place tomorrow. It's clear why the market is in no rush to make trading decisions. The downward trend persists but is very unstable, as we've already mentioned. If U.S. inflation shows a lower value than the forecast, the dollar could easily and quickly plummet. Of course, we believe the euro should fall significantly for a long time, but we are not yet sure that the market has fully priced in all the Federal Reserve rate cuts planned for the next couple of years.
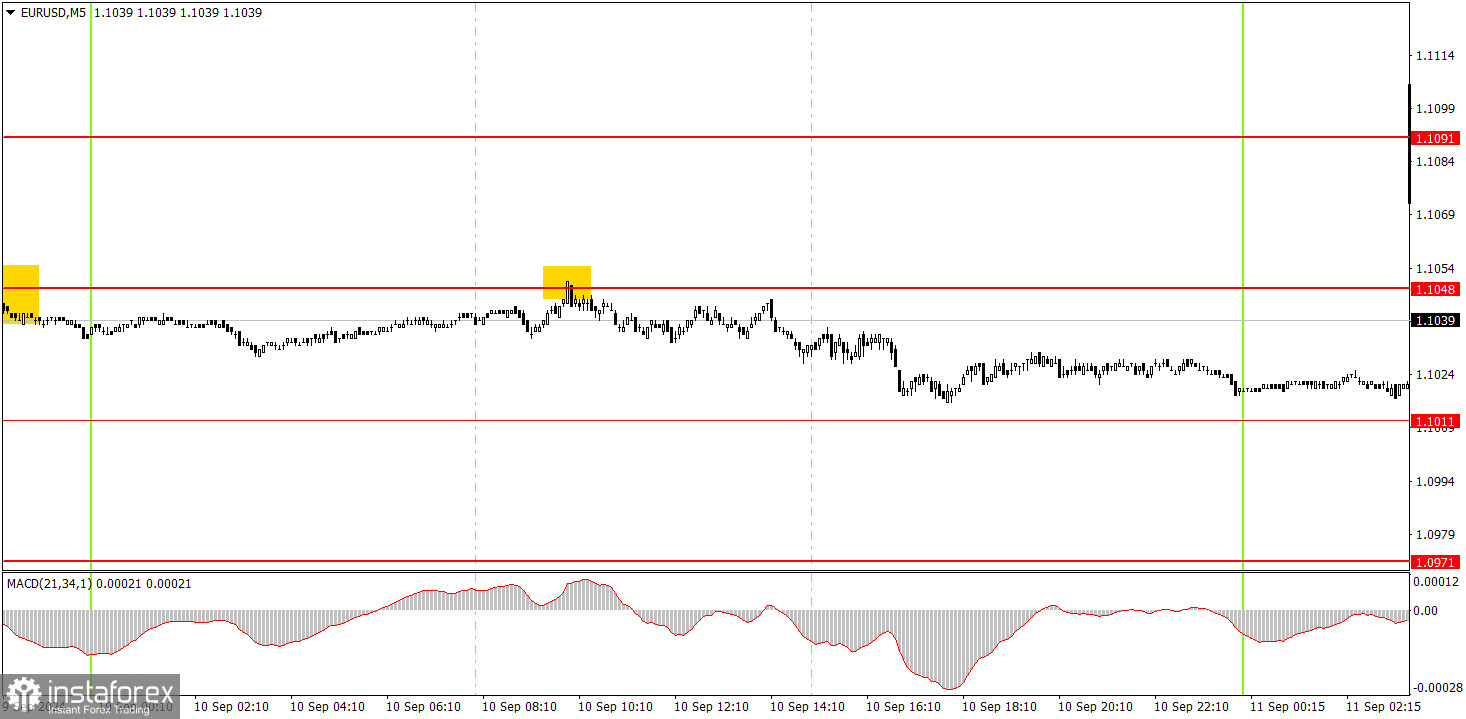
Only one trading signal was generated in the 5-minute time frame on Tuesday. At the start of the European trading session, the price rebounded from the 1.1048 level, after which it managed to move down by about 15-20 pips. Volatility was very weak. Nevertheless, novice traders could make a small profit from this trade, and a 15-pip profit with a total volatility of 35 pips is a very good result.
In the hourly time frame, the EUR/USD pair has consolidated below the ascending trend line and, for the first time in a long while, has a chance to form a downward trend that would be logical and consistent with all factors and types of analysis. Unfortunately, illogical dollar sales could quickly resume, as no one knows how long the market will continue to price in the Fed's monetary policy easing, which has yet to start. The market continues to price in almost all future rate cuts by the Fed into the dollar's price, and U.S. macroeconomic data often disappoint rather than please.
On Wednesday, novice traders may expect a new decline in the pair, but everything will depend on the U.S. inflation report in the second half of the day.
The key levels to consider on the 5M time frame are 1.0726-1.0733, 1.0797-1.0804, 1.0838-1.0856, 1.0888-1.0896, 1.0940, 1.0971, 1.1011, 1.1048, 1.1091, 1.1132, 1.1191, and 1.1275-1.1292. No significant events are planned for Wednesday in the Eurozone, but in the U.S., the CPI for August, considered the "event of the week," will be released.
1) The strength of a signal is determined by the time it takes for the signal to form (bounce or level breakthrough). The less time it took, the stronger the signal.
2) If two or more trades were opened around any level due to false signals, subsequent signals from that level should be ignored.
3) In a flat market, any currency pair can form multiple false signals or none at all. In any case, it's better to stop trading at the first signs of a flat market.
4) Trades should be opened between the start of the European session and midway through the U.S. session. After this period, all trades must be closed manually.
5) In the hourly time frame, trades based on MACD signals are only advisable amidst good volatility and a trend confirmed by a trendline or trend channel.
6) If two levels are too close to each other (5 to 20 pips), they should be considered a support or resistance area.
7) After moving 15 pips in the intended direction, the Stop Loss should be set to break even.
Support and Resistance price levels: targets for opening long or short positions. You can place Take Profit levels around them.
Red lines: channels or trend lines that depict the current trend and indicate the preferred trading direction.
The MACD indicator (14,22,3): encompassing both the histogram and signal line, acts as an auxiliary tool and can also be used as a source of signals.
Important speeches and reports (always noted in the news calendar) can profoundly influence the movement of a currency pair. Hence, trading during their release calls for heightened caution. It may be reasonable to exit the market to avoid sharp price reversals against the prevailing movement.
For beginners, it's important to remember that not every trade will yield profit. Developing a clear strategy and effective money management is key to success in trading over the long term.
InstaForex analytical reviews will make you fully aware of market trends! Being an InstaForex client, you are provided with a large number of free services for efficient trading.

