 Permanecer
Condições de Negociações
Ferramentas


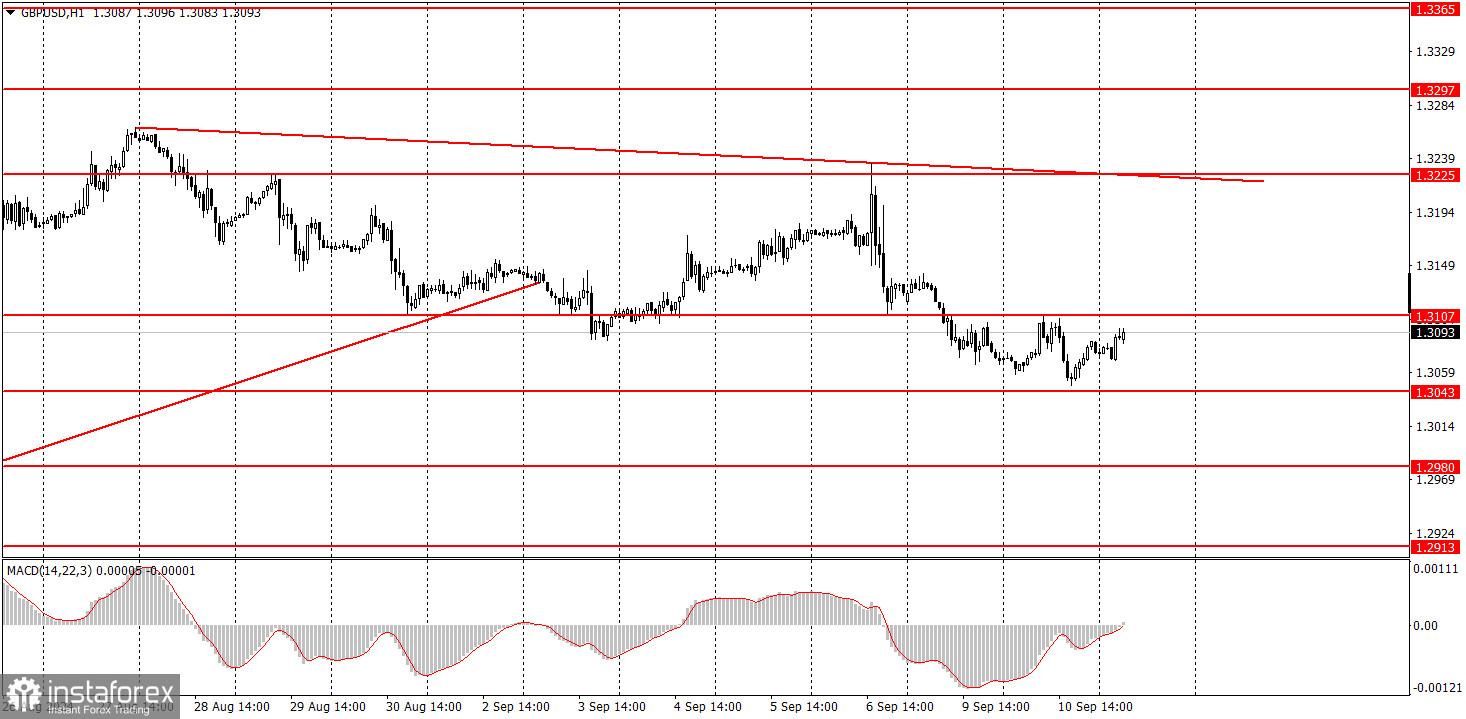
On Tuesday, the GBP/USD pair showed only one thing — a complete reluctance to trade. Unlike the euro, the British pound had some interesting reports at its disposal. However, as we warned, they almost did not impact market sentiment. The UK unemployment rate decreased by 0.1% y/y, as expected. Wage growth slowed down slightly more than anticipated, and the number of unemployed increased much less than the market expected. Thus, we can conclude that the UK reports were positive, but the market is now interested in only one thing — the Federal Reserve's monetary policy. As a result, we saw a slight strengthening of the British currency, which had no impact on the technical picture. The price couldn't even consolidate above the nearest level of 1.3107. Therefore, the downward trend persists, and the corrective decline continues.
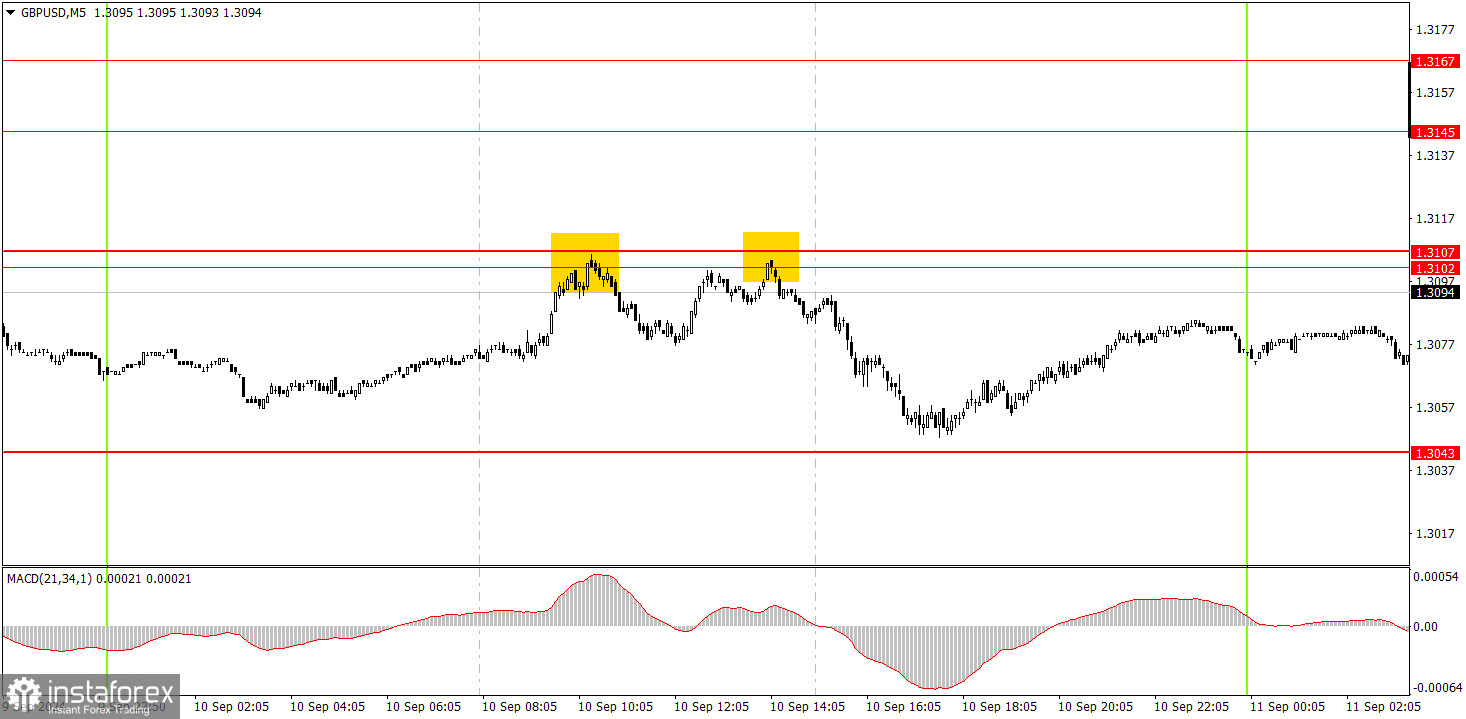
In the 5-minute time frame on Tuesday, two sell signals were formed around the area of 1.3102-1.3107. These signals duplicated each other, so only one short position should have been opened. Subsequently, the price dropped toward the 1.3043 level but didn't fully reach it. However, novice traders had ample time and opportunities to close the trade at maximum profit.
In the hourly time frame, GBP/USD has a good chance of resuming the global downtrend or at least seeing a significant correction. The British pound remains overbought, the dollar is undervalued, and the market is still much more inclined to sell dollars than to buy them. So far, the pound only shows a minor bearish correction. It is too early to speak of a full-fledged downtrend. The much-anticipated Fed meeting will take place next week, and after that, conclusions can be made regarding the medium-term direction of the dollar.
On Wednesday, the pair could move in any direction, as no one can know in advance what the U.S. inflation report will show or how the market will react to it.
The key levels to consider on the 5M time frame are 1.2605-1.2633, 1.2684-1.2693, 1.2748, 1.2791-1.2798, 1.2848-1.2860, 1.2913, 1.2980-1.2993, 1.3043, 1.3102-1.3107, 1.3145-1.3167, 1.3225, 1.3272, 1.3310. On Wednesday, the UK will release GDP reports for July in both monthly and three-month formats. There will also be an industrial production report. However, these data are unlikely to trigger a significant market reaction. In the U.S., the Consumer Price Index for August will be released.
1) The strength of a signal is determined by the time it takes for the signal to form (bounce or level breakthrough). The less time it took, the stronger the signal.
2) If two or more trades were opened around any level due to false signals, subsequent signals from that level should be ignored.
3) In a flat market, any currency pair can form multiple false signals or none at all. In any case, it's better to stop trading at the first signs of a flat market.
4) Trades should be opened between the start of the European session and midway through the U.S. session. After this period, all trades must be closed manually.
5) In the hourly time frame, trades based on MACD signals are only advisable amidst good volatility and a trend confirmed by a trendline or trend channel.
6) If two levels are too close to each other (5 to 20 pips), they should be considered a support or resistance area.
7) After moving 20 pips in the intended direction, the Stop Loss should be set to break even.
Support and Resistance price levels: targets for opening long or short positions. You can place Take Profit levels around them.
Red lines: channels or trend lines that depict the current trend and indicate the preferred trading direction.
The MACD indicator (14,22,3): encompassing both the histogram and signal line, acts as an auxiliary tool and can also be used as a source of signals.
Important speeches and reports (always noted in the news calendar) can profoundly influence the movement of a currency pair. Hence, trading during their release calls for heightened caution. It may be reasonable to exit the market to avoid sharp price reversals against the prevailing movement.
For beginners, it's important to remember that not every trade will yield profit. Developing a clear strategy and effective money management is key to success in trading over the long term.
InstaForex analytical reviews will make you fully aware of market trends! Being an InstaForex client, you are provided with a large number of free services for efficient trading.


