 Permanecer
Condições de Negociações
Ferramentas


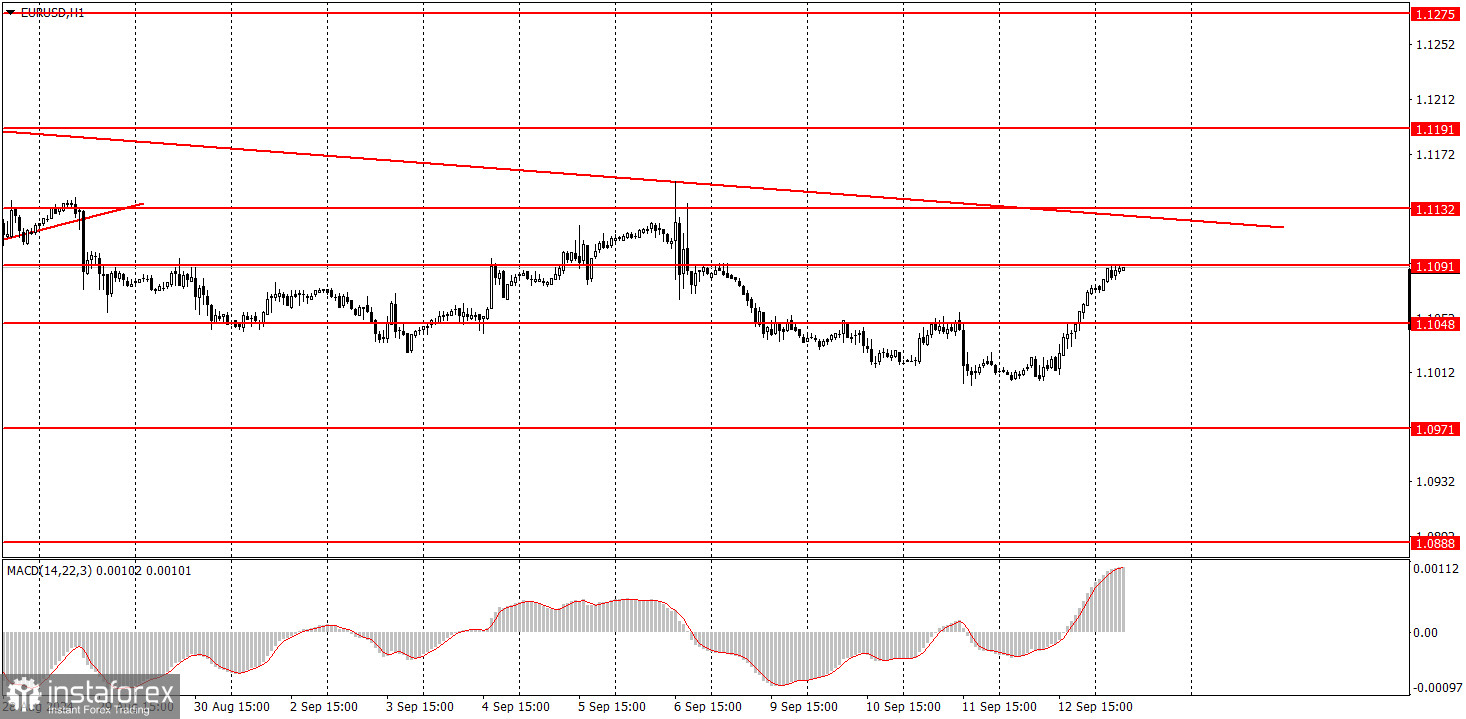
O par EUR/USD apresentou um aumento inesperado na quinta-feira. Ontem, o Banco Central Europeu decidiu, pela segunda vez, reduzir suas três taxas básicas. Embora a flexibilização do BCE tenha correspondido exatamente às expectativas do mercado, ainda é uma questão de flexibilização. Portanto, a alta do euro após a redução das taxas básicas é surpreendente. No entanto, os traders já devem estar acostumados com essas realidades.
Em 2024, todos os movimentos seguem o mesmo padrão: o euro sobe com praticamente todos os dados, embora ocasionalmente faça pausas para correções. Recentemente, vimos uma correção que durou várias semanas, e parecia que a tendência de alta sem fundamentos estava se esgotando. Mas não foi o caso - o euro está subindo novamente, mesmo com a redução das taxas pelo BCE. Por enquanto, o preço permanece abaixo da linha de tendência, mas com esse sentimento de mercado, isso pode não durar muito.
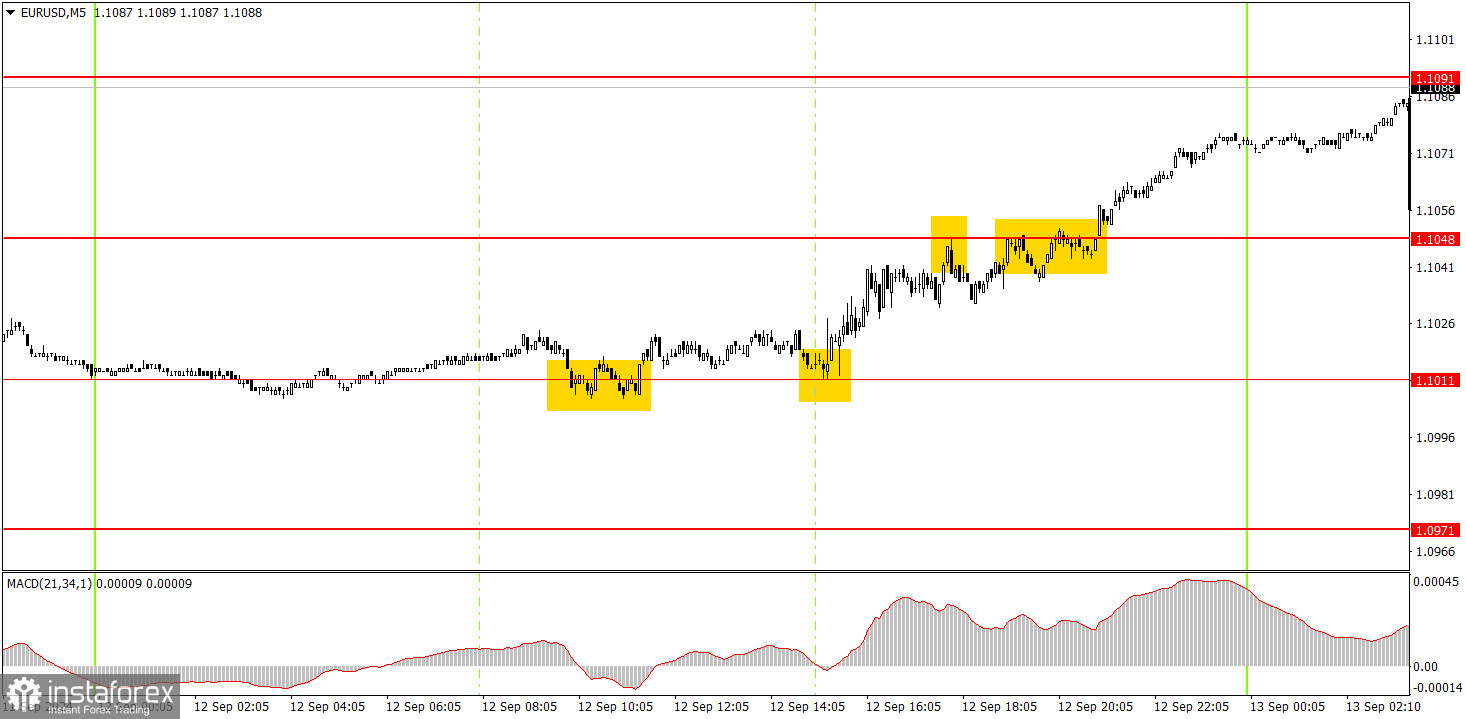
Vários sinais de negociação foram formados no período gráfico de 5 minutos na quinta-feira. O preço ficou parado durante toda a sessão europeia, mas saltou duas vezes do nível 1,1011. Esses sinais forneceram razões para abrir posições de compra. Em seguida, o preço atingiu a marca de 1,1048, onde os lucros já podiam ser realizados, porque não havia razão para esperar um maior crescimento do euro. No entanto, o crescimento continuou até o nível 1,1091.
No período horário, o par EUR/USD tem, pela primeira vez em muito tempo, a oportunidade de formar uma tendência de baixa que seria lógica e consistente com todos os fatores e tipos de análise. No entanto, vendas irracionais de dólares podem ser retomadas rapidamente, já que ninguém sabe por quanto tempo o mercado continuará a precificar a flexibilização da política monetária do Federal Reserve. O mercado ainda precifica todos os futuros cortes de taxas pelo Fed no valor do dólar, sem dar atenção à política de flexibilização do BCE.
Na sexta-feira, os traders iniciantes podem negociar a partir do nível de 1,1091. Um salto a partir desse nível permitiria considerar uma venda, enquanto um avanço sinalizaria uma compra.
Os níveis-chave a serem considerados no período gráfico de 5 minutos são: 1,0726-1,0733, 1,0797-1,0804, 1,0838-1,0856, 1,0888-1,0896, 1,0940, 1,0971, 1,1011, 1,1048, 1,1091, 1,1132, 1,1191 e 1,1275-1,1292. Na sexta-feira, a zona do euro deve divulgar um relatório secundário de produção industrial, e os EUA publicarão o índice secundário de sentimento do consumidor da Universidade de Michigan. É improvável que esses dados provoquem uma reação significativa do mercado.
1) A força de um sinal é determinada pelo tempo que leva para o sinal se formar (salto ou rompimento de nível). Quanto menos tempo levar, mais forte será o sinal.
2) Se duas ou mais negociações foram abertas próximo a qualquer nível devido a sinais falsos, os sinais subsequentes desse nível devem ser ignorados.
3) Em um mercado plano, qualquer par de moedas pode formar vários sinais falsos ou nenhum. Em qualquer caso, é melhor parar de negociar aos primeiros sinais de um mercado estável.
4) As negociações devem ser abertas entre o início da sessão europeia e a metade da sessão americana. Após esse período, todas as negociações devem ser fechadas manualmente.
5) No período de uma hora, as negociações baseadas em sinais MACD só são aconselháveis em meio a uma boa volatilidade e uma tendência confirmada por uma linha de tendência ou canal de tendência.
6) Se dois níveis estiverem muito próximos um do outro (5 a 20 pips), eles devem ser considerados uma área de suporte ou resistência.
7) Após mover-se 15 pips na direção pretendida, o Stop Loss deve ser definido para atingir o ponto de equilíbrio.
Níveis de preço de suporte e resistência: alvos para abrir posições de compra ou venda. Você pode colocar níveis de Take Profit em torno deles.
Linhas vermelhas: canais ou linhas de tendência que retratam a tendência atual e indicam a direção de negociação preferida.
O indicador MACD (14,22,3): englobando o histograma e a linha de sinal, atua como uma ferramenta auxiliar e também pode ser usado como fonte de sinais.
Discursos e relatórios importantes (sempre anotados no calendário de notícias) podem influenciar profundamente o movimento de um par de moedas. Portanto, negociar durante sua divulgação exige maior cautela. Pode ser razoável sair do mercado para evitar reversões bruscas de preço contra o movimento predominante.
Para os iniciantes, é importante lembrar que nem todas as negociações darão lucro. O desenvolvimento de uma estratégia clara e o gerenciamento eficaz do dinheiro são fundamentais para o sucesso da negociação a longo prazo.
InstaForex analytical reviews will make you fully aware of market trends! Being an InstaForex client, you are provided with a large number of free services for efficient trading.


