 Permanecer
Condições de Negociações
Ferramentas


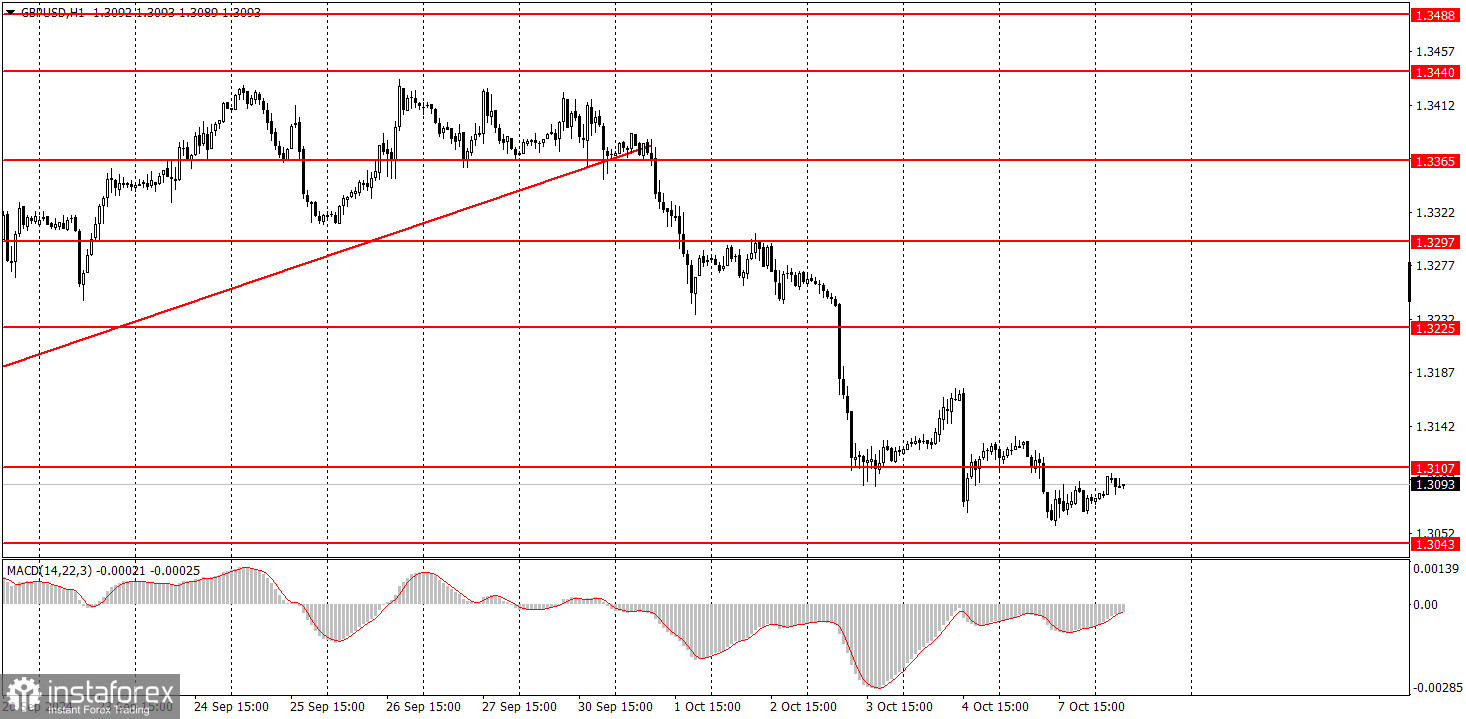
On Monday, the GBP/USD pair continued its downward movement despite weak momentum. It is clear from the chart that the downward momentum is fading, and without new data, traders are no longer willing to sell the British currency. There will be very little new data this week, but the only critical report on U.S. inflation could trigger the pair's rise, which would be technically beneficial. If a new medium-term downtrend starts now, it would be good to see a correction before resuming the decline. U.S. inflation might slow down to 2.3%, which was hard to believe just a few months ago. The faster inflation falls, the sooner the Federal Reserve might lower rates. In our view, the market has already priced in most, if not all, of the monetary policy easing cycle, but slightly more dovish actions by the Fed could trigger a new decline in the U.S. dollar.
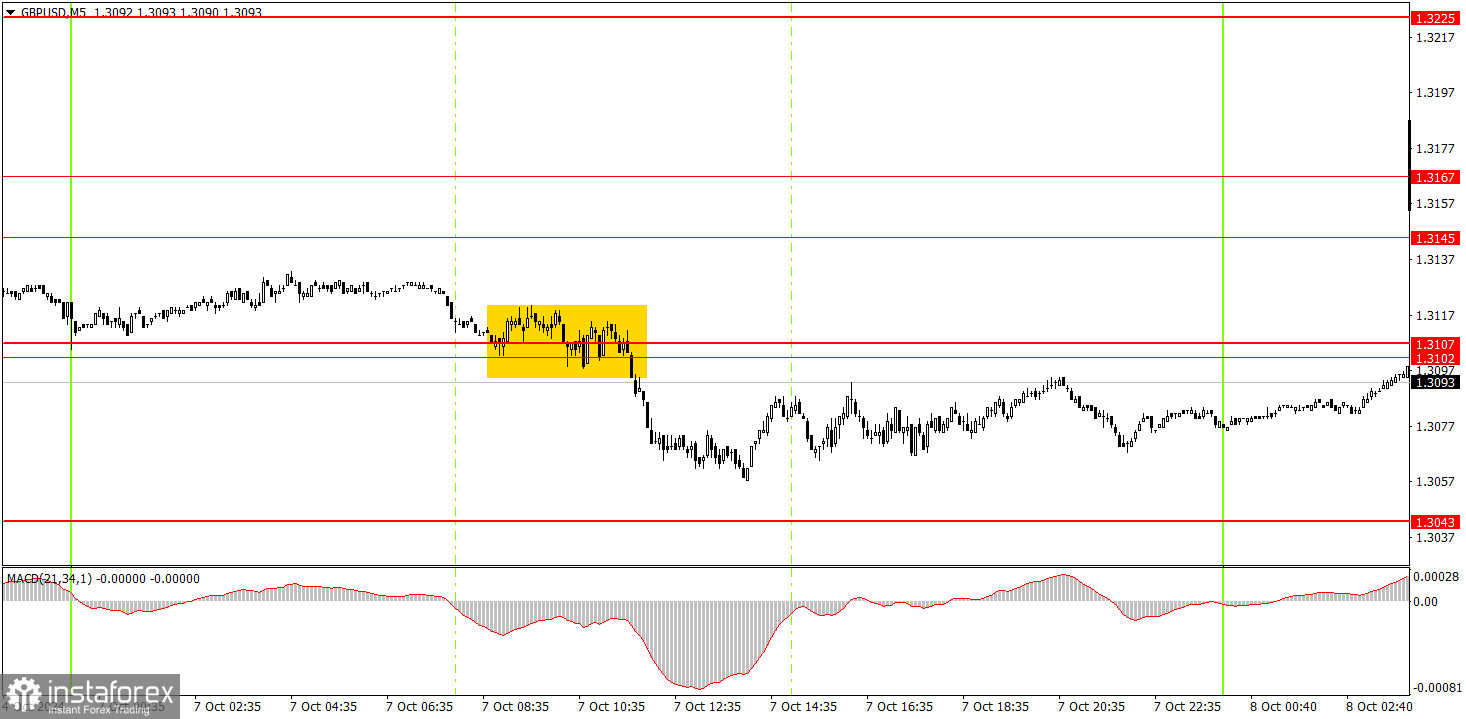
One trading signal was formed in the 5-minute time frame (TF) on Monday. During the European trading session, the price broke through the 1.3102-1.3107 area, allowing novice traders to open short positions. The price did not reach the nearest target but traded below the designated area for the rest of the day. Therefore, the sell trade could be closed at any point, and it still would have been profitable.
The GBP/USD pair broke the upward trend in the hourly TF. The U.S. dollar has begun its much-anticipated rise, but traders should be cautious with selling since Friday showed that the market is not eager to sell the pound. A correction is likely due, but the key is that it should be a correction, not the start of a new, unjustified upward trend.
On Tuesday, the pound may begin an upward correction, and trades should be based on the 1.3102-1.3107 area, above which the price may consolidate. The macroeconomic background should not prevent the pound from correcting.
In the 5-minute TF, trades can be made based on the levels 1.2913, 1.2980-1.2993, 1.3043, 1.3102-1.3107, 1.3145-1.3167, 1.3225, 1.3272, 1.3365, 1.3428-1.3440, 1.3488, and 1.3537. No significant events are scheduled in the UK or the U.S. on Tuesday, so volatility may be low, and the British currency may move in a corrective direction throughout the day.
Support and Resistance Price Levels: These levels serve as targets when opening buy or sell positions. They can also be used as points to set Take Profit levels.
Red Lines: These represent channels or trend lines that display the current trend and indicate the preferred trading direction.
MACD Indicator (14,22,3): The histogram and signal line serve as an auxiliary indicator that can also be used as a source of trading signals.
Important Speeches and Reports (always found in the news calendar) can significantly impact the movement of a currency pair. Therefore, trading should be done with maximum caution during their release, or you may choose to exit the market to avoid a sharp price reversal against the preceding movement.
For Beginners Trading on the Forex Market: It's essential to remember that not every trade will be profitable. Developing a clear strategy and practicing money management is key to achieving long-term success in trading.
InstaForex analytical reviews will make you fully aware of market trends! Being an InstaForex client, you are provided with a large number of free services for efficient trading.

