Essas informações são fornecidas a clientes profissionais e de varejo como parte da comunicação de marketing. Elas não contêm e não devem ser interpretadas como consultoria, recomendação de investimento ou uma oferta ou solicitação para se envolver em qualquer transação ou estratégia em instrumentos financeiros. O desempenho passado não é uma garantia ou previsão de desempenho futuro. A Instant Trading EU Ltd. não se responsabiliza pela exatidão ou integridade das informações fornecidas, ou por qualquer perda decorrente de qualquer investimento com base em análises, previsões ou outras informações fornecidas por um funcionário da Empresa, ou de outra forma. O termo de responsabilidade completo está disponível aqui.
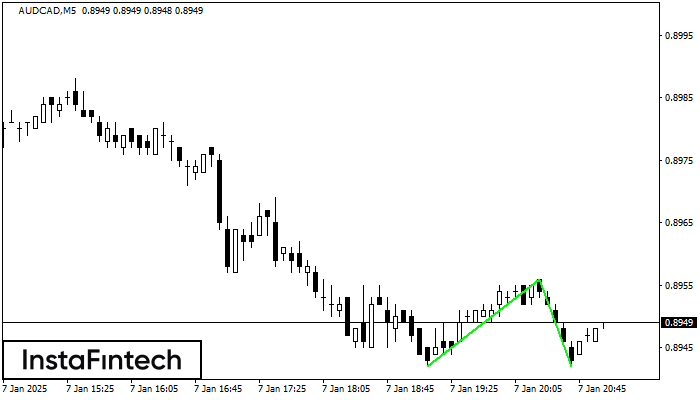
Double Bottom
was formed on 07.01 at 21:01:18 (UTC+0)
signal strength 1 of 5
was formed on 07.01 at 21:01:18 (UTC+0)
signal strength 1 of 5

The Double Bottom pattern has been formed on AUDCAD M5; the upper boundary is 0.8956; the lower boundary is 0.8942. The width of the pattern is 14 points. In case of a break of the upper boundary 0.8956, a change in the trend can be predicted where the width of the pattern will coincide with the distance to a possible take profit level.
The M5 and M15 time frames may have more false entry points.
Figure
Instrument
Timeframe
Trend
Signal Strength

 Permanecer


