
 Permanecer


Padrões são modelos gráficos que são formados no gráfico pelo preço. Segundo um dos postulados da análise técnica, a história (movimento de preços) se repete. Isso significa que os movimentos de preços geralmente são semelhantes nas mesmas situações, o que possibilita prever o desenvolvimento futuro da situação com alta probabilidade.
Os padrões relevantes da InstaForex são um serviço fácil de usar, que permite que você esteja ciente das últimas mudanças no mercado e reaja a indícios do mercado a tempo. Em nosso serviço, você sempre encontrará os padrões mais recentes e relevantes em qualquer par e em qualquer período gráfico.
was formed on 02.04 at 14:15:10 (UTC+0)
signal strength 1 of 5
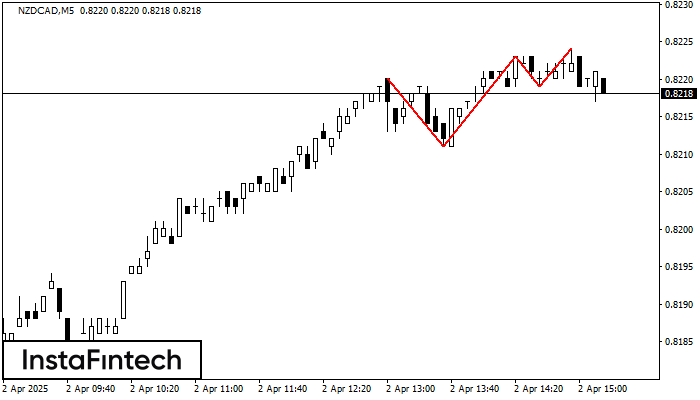
The Triple Top pattern has formed on the chart of the NZDCAD M5 trading instrument. It is a reversal pattern featuring the following characteristics: resistance level -4, support level -8, and pattern’s width 9. Forecast If the price breaks through the support level 0.8211, it is likely to move further down to 0.8208.
The M5 and M15 time frames may have more false entry points.
Veja também
- All
- Double Top
- Flag
- Head and Shoulders
- Pennant
- Rectangle
- Triangle
- Triple top
- All
- #AAPL
- #AMZN
- #EBAY
- #FB
- #GOOG
- #INTC
- #KO
- #MA
- #MCD
- #MSFT
- #NTDOY
- #PEP
- #TSLA
- #TWTR
- AUDCAD
- AUDCHF
- AUDJPY
- AUDUSD
- EURCAD
- EURCHF
- EURGBP
- EURJPY
- EURNZD
- EURRUB
- EURUSD
- GBPAUD
- GBPCHF
- GBPJPY
- GBPUSD
- GOLD
- NZDCAD
- NZDCHF
- NZDJPY
- NZDUSD
- SILVER
- USDCAD
- USDCHF
- USDJPY
- USDRUB
- All
- M5
- M15
- M30
- H1
- D1
- All
- Buy
- Sale
- All
- 1
- 2
- 3
- 4
- 5
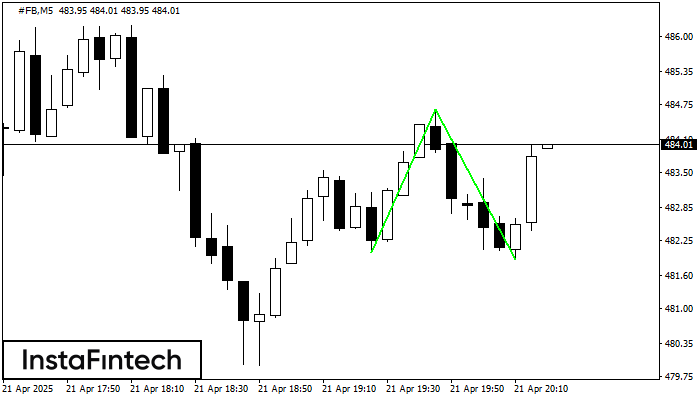
O padrão Fundo duplo foi formado em #FB M5; o limite superior é 484.65; o limite inferior é 481.90. A largura do padrão é de 263 pontos. No caso
Os intervalos M5 e M15 podem ter mais pontos de entrada falsos.
Open chart in a new window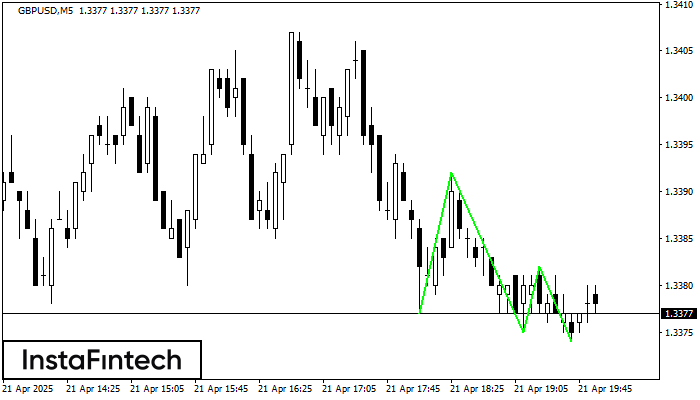
O padrão Fundo triplo foi formado em GBPUSD M5. Possui as seguintes características: nível de resistência 1.3392/1.3382; nível de suporte 1.3377/1.3374; a largura é de 15 pontos. Se houver
Os intervalos M5 e M15 podem ter mais pontos de entrada falsos.
Open chart in a new window
O padrão Fundo triplo foi formado no gráfico do instrumento de negociação #AMZN M5. O padrão sinaliza uma mudança na tendência de baixa para alta no caso de quebra
Os intervalos M5 e M15 podem ter mais pontos de entrada falsos.
Open chart in a new window


