
 Permanecer


Padrões são modelos gráficos que são formados no gráfico pelo preço. Segundo um dos postulados da análise técnica, a história (movimento de preços) se repete. Isso significa que os movimentos de preços geralmente são semelhantes nas mesmas situações, o que possibilita prever o desenvolvimento futuro da situação com alta probabilidade.
Os padrões relevantes da InstaForex são um serviço fácil de usar, que permite que você esteja ciente das últimas mudanças no mercado e reaja a indícios do mercado a tempo. Em nosso serviço, você sempre encontrará os padrões mais recentes e relevantes em qualquer par e em qualquer período gráfico.
was formed on 02.04 at 20:25:18 (UTC+0)
signal strength 1 of 5
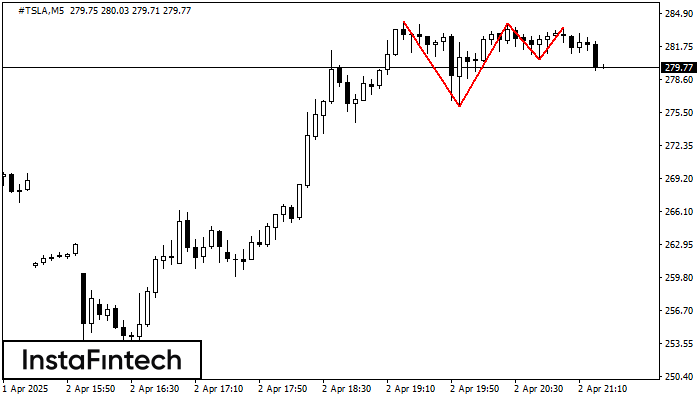
On the chart of the #TSLA M5 trading instrument, the Triple Top pattern that signals a trend change has formed. It is possible that after formation of the third peak, the price will try to break through the resistance level 276.07, where we advise to open a trading position for sale. Take profit is the projection of the pattern’s width, which is 805 points.
The M5 and M15 time frames may have more false entry points.
Veja também
- All
- Double Top
- Flag
- Head and Shoulders
- Pennant
- Rectangle
- Triangle
- Triple top
- All
- #AAPL
- #AMZN
- #EBAY
- #FB
- #GOOG
- #INTC
- #KO
- #MA
- #MCD
- #MSFT
- #NTDOY
- #PEP
- #TSLA
- #TWTR
- AUDCAD
- AUDCHF
- AUDJPY
- AUDUSD
- EURCAD
- EURCHF
- EURGBP
- EURJPY
- EURNZD
- EURRUB
- EURUSD
- GBPAUD
- GBPCHF
- GBPJPY
- GBPUSD
- GOLD
- NZDCAD
- NZDCHF
- NZDJPY
- NZDUSD
- SILVER
- USDCAD
- USDCHF
- USDJPY
- USDRUB
- All
- M5
- M15
- M30
- H1
- D1
- All
- Buy
- Sale
- All
- 1
- 2
- 3
- 4
- 5

Vzor Trojité dno se vytvořil na grafu M30 u obchodního nástroje USDJPY. Vzor naznačuje změnu trendu ze sestupného na vzestupný v případě průlomu hladiny 141.08/141.05
Open chart in a new window
Vzor Dvojité dno se vytvořil na grafu H1 u nástroje AUDCHF; horní hranice je 0.5198; spodní hranice je 0.5165. Šířka vzoru je 34 bodů. V případě průlomu horní hranice 0.5198
Open chart in a new window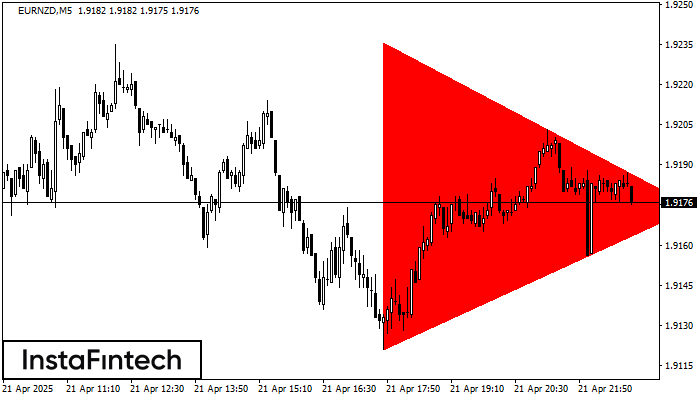
Podle grafu M5 vytvořil EURNZD vzor Medvědí symetrický trojúhelník. Popis: Spodní hranice je 1.9121/1.9174 a horní hranice je 1.9236/1.9174. Šířka vzoru je podle grafu -115 pipů. Vytvoření vzoru Medvědí symetrický
Časové rámce M5 a M15 mohou mít více falešných vstupních bodů.
Open chart in a new window


